a selection of my recent data vis work
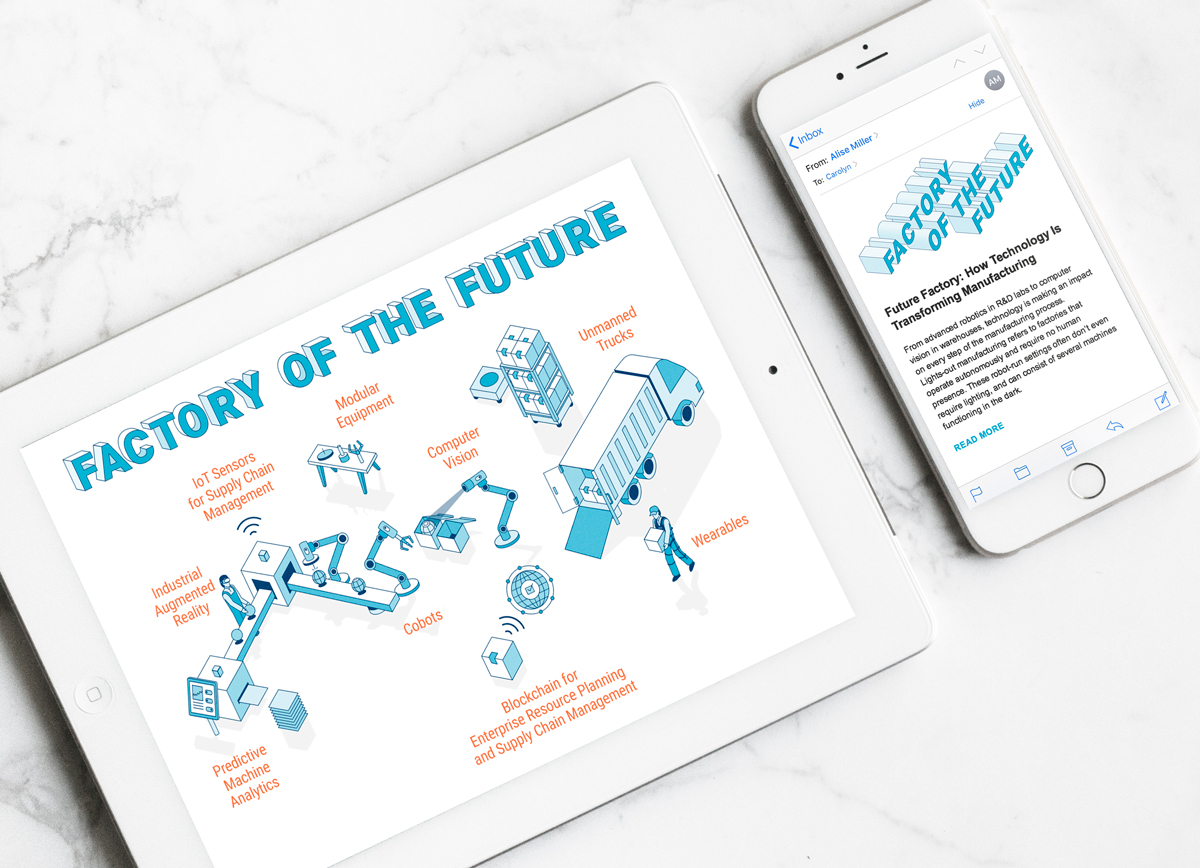
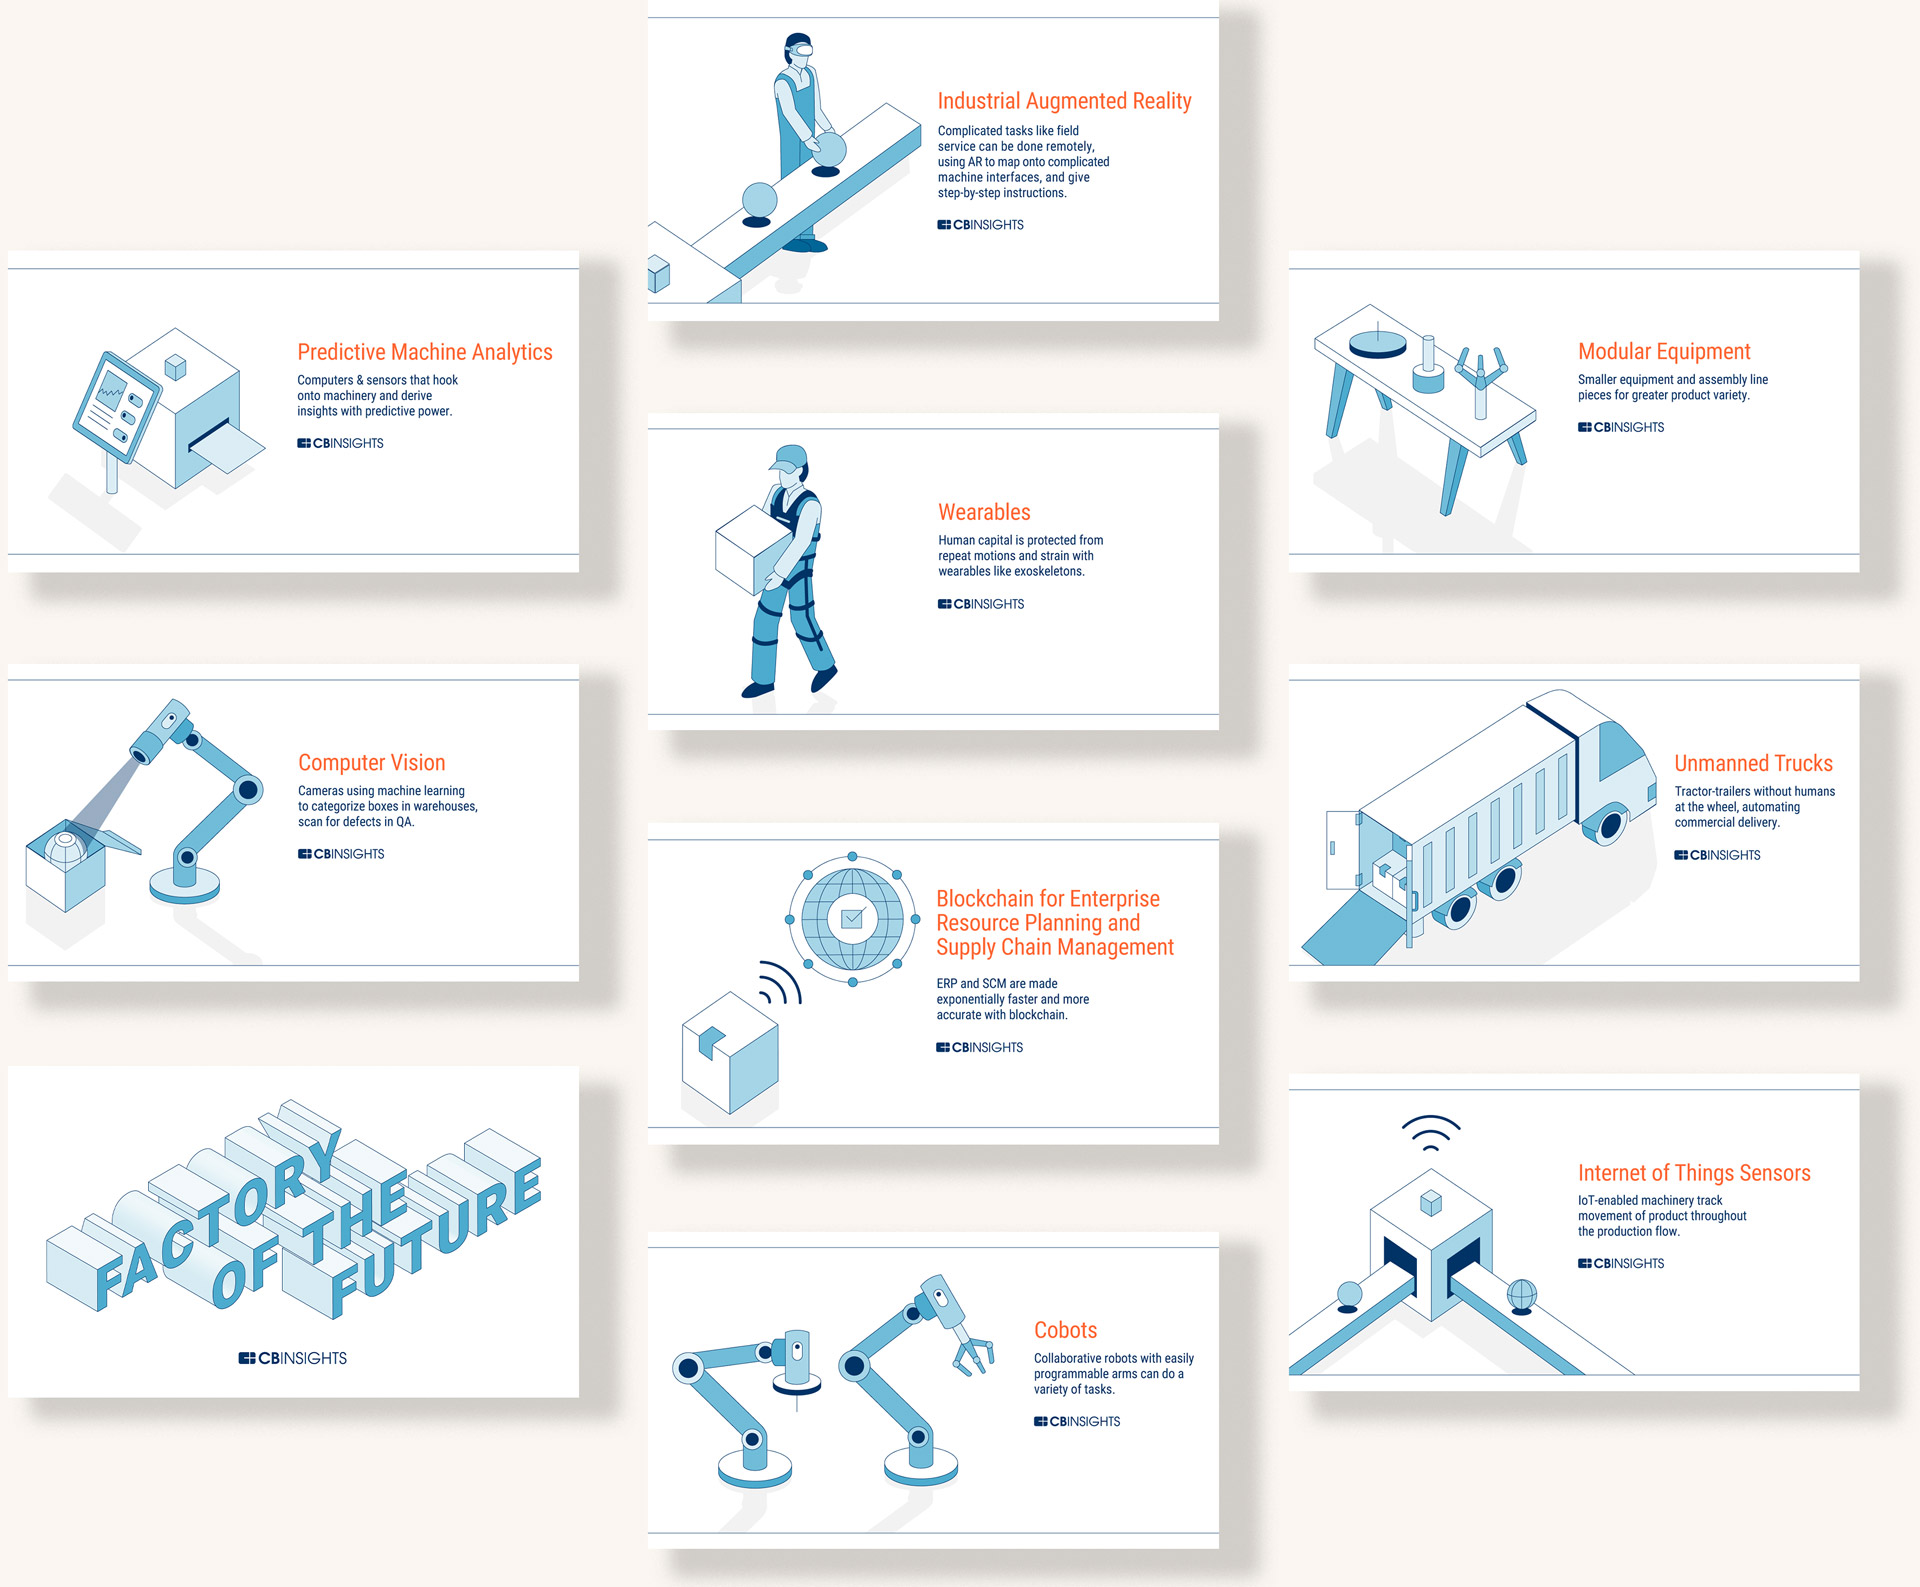
infographic and slides for a deep-dive editorial on tech innovation in the manufacturing sector:
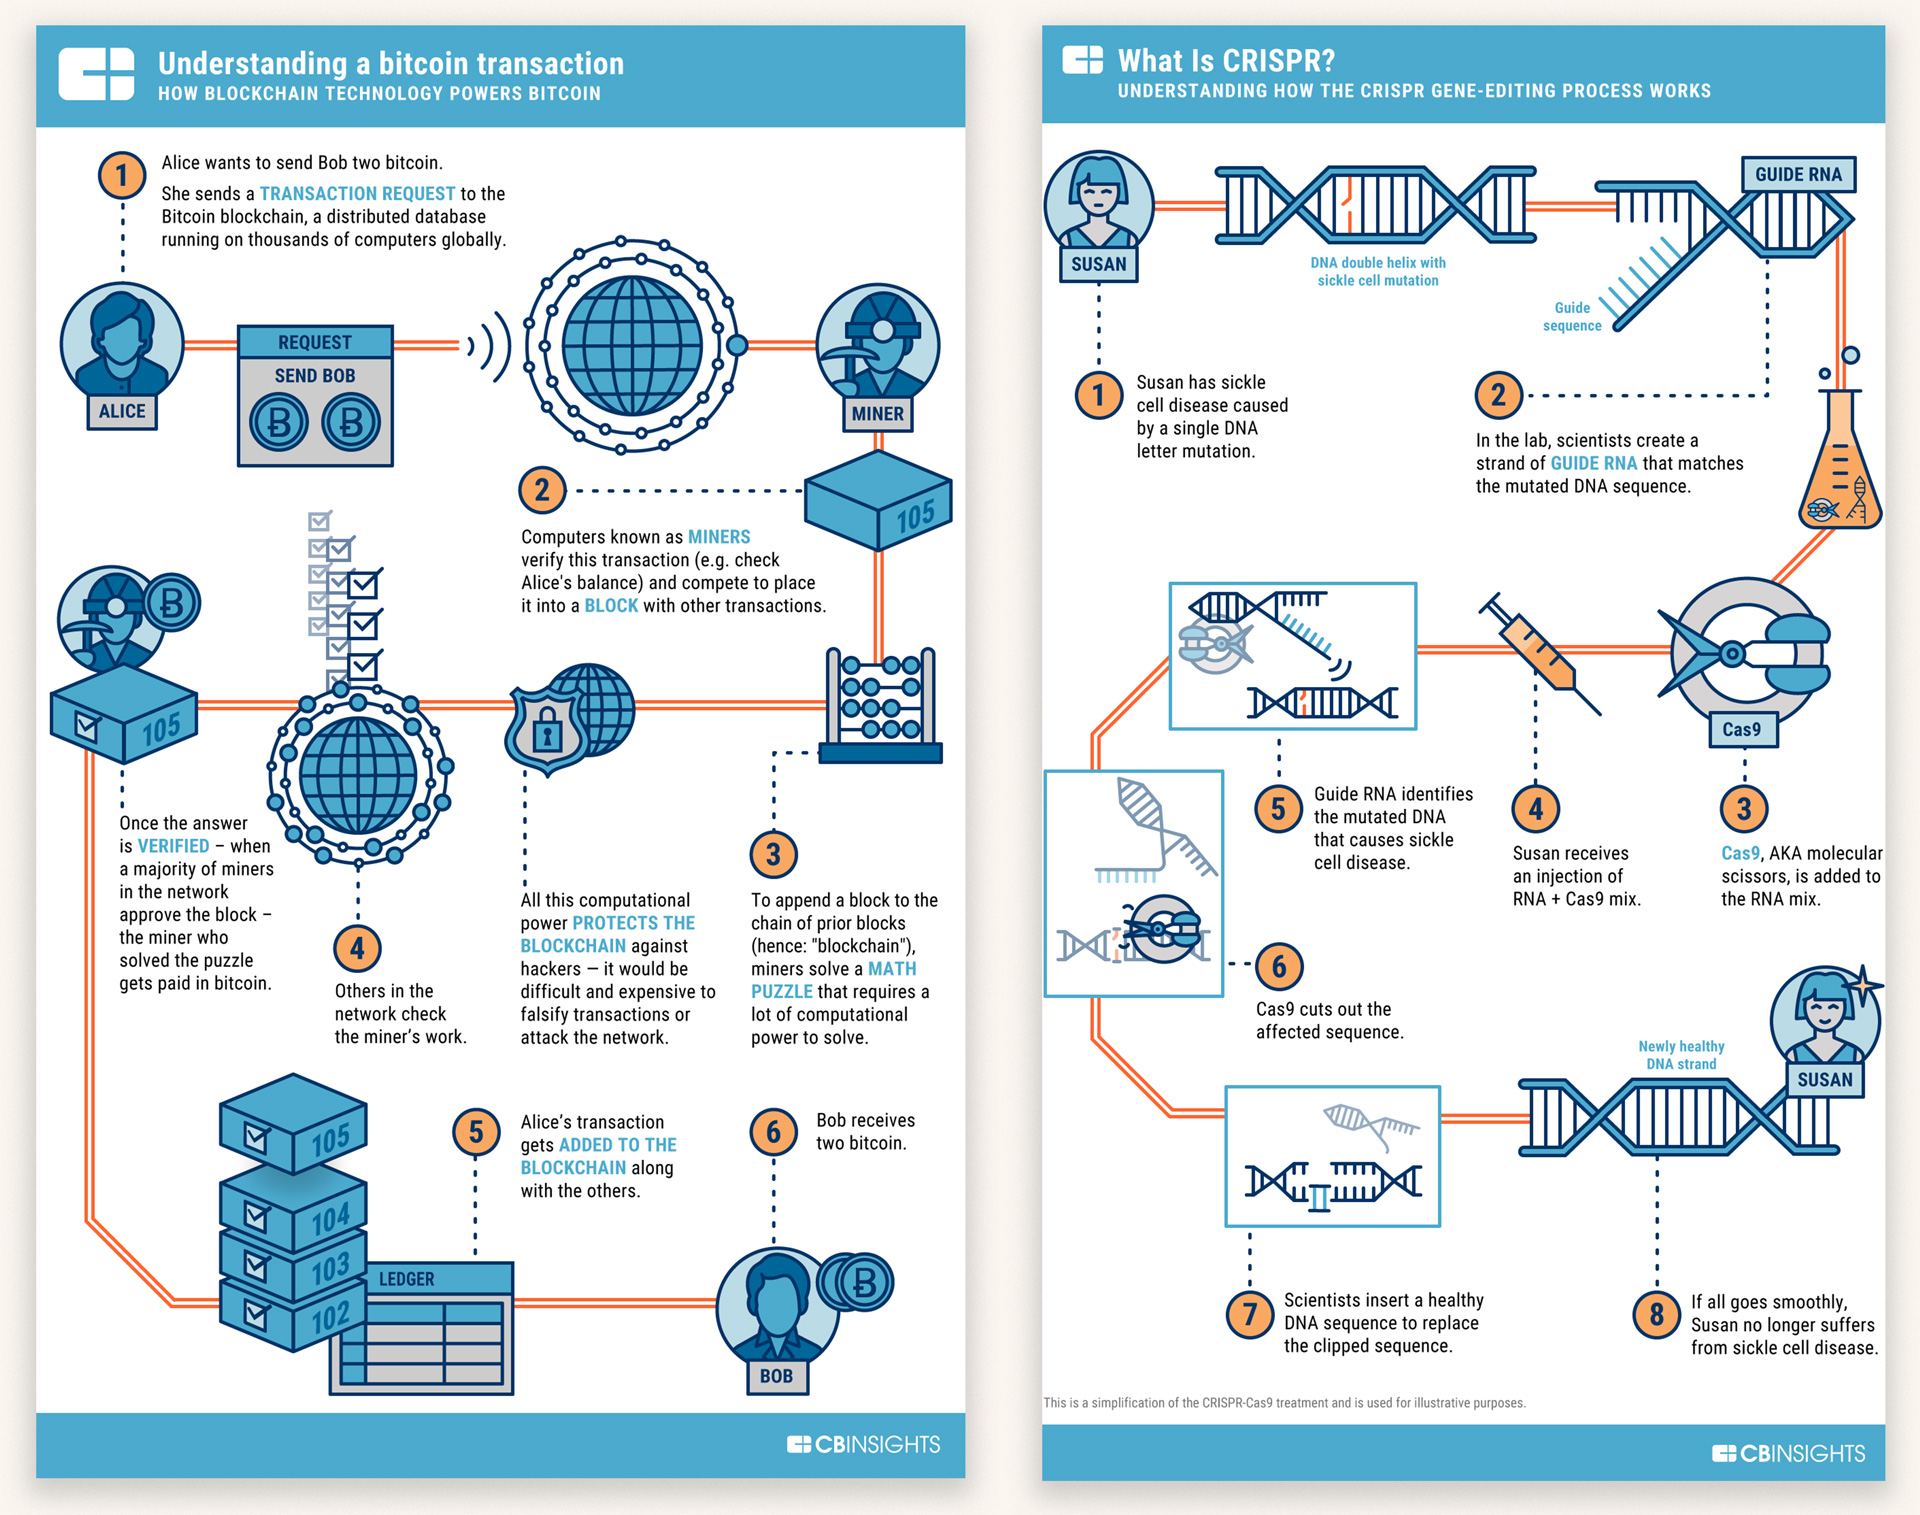
infographic explainers for a general audience on blockchain technology and CRISPR:
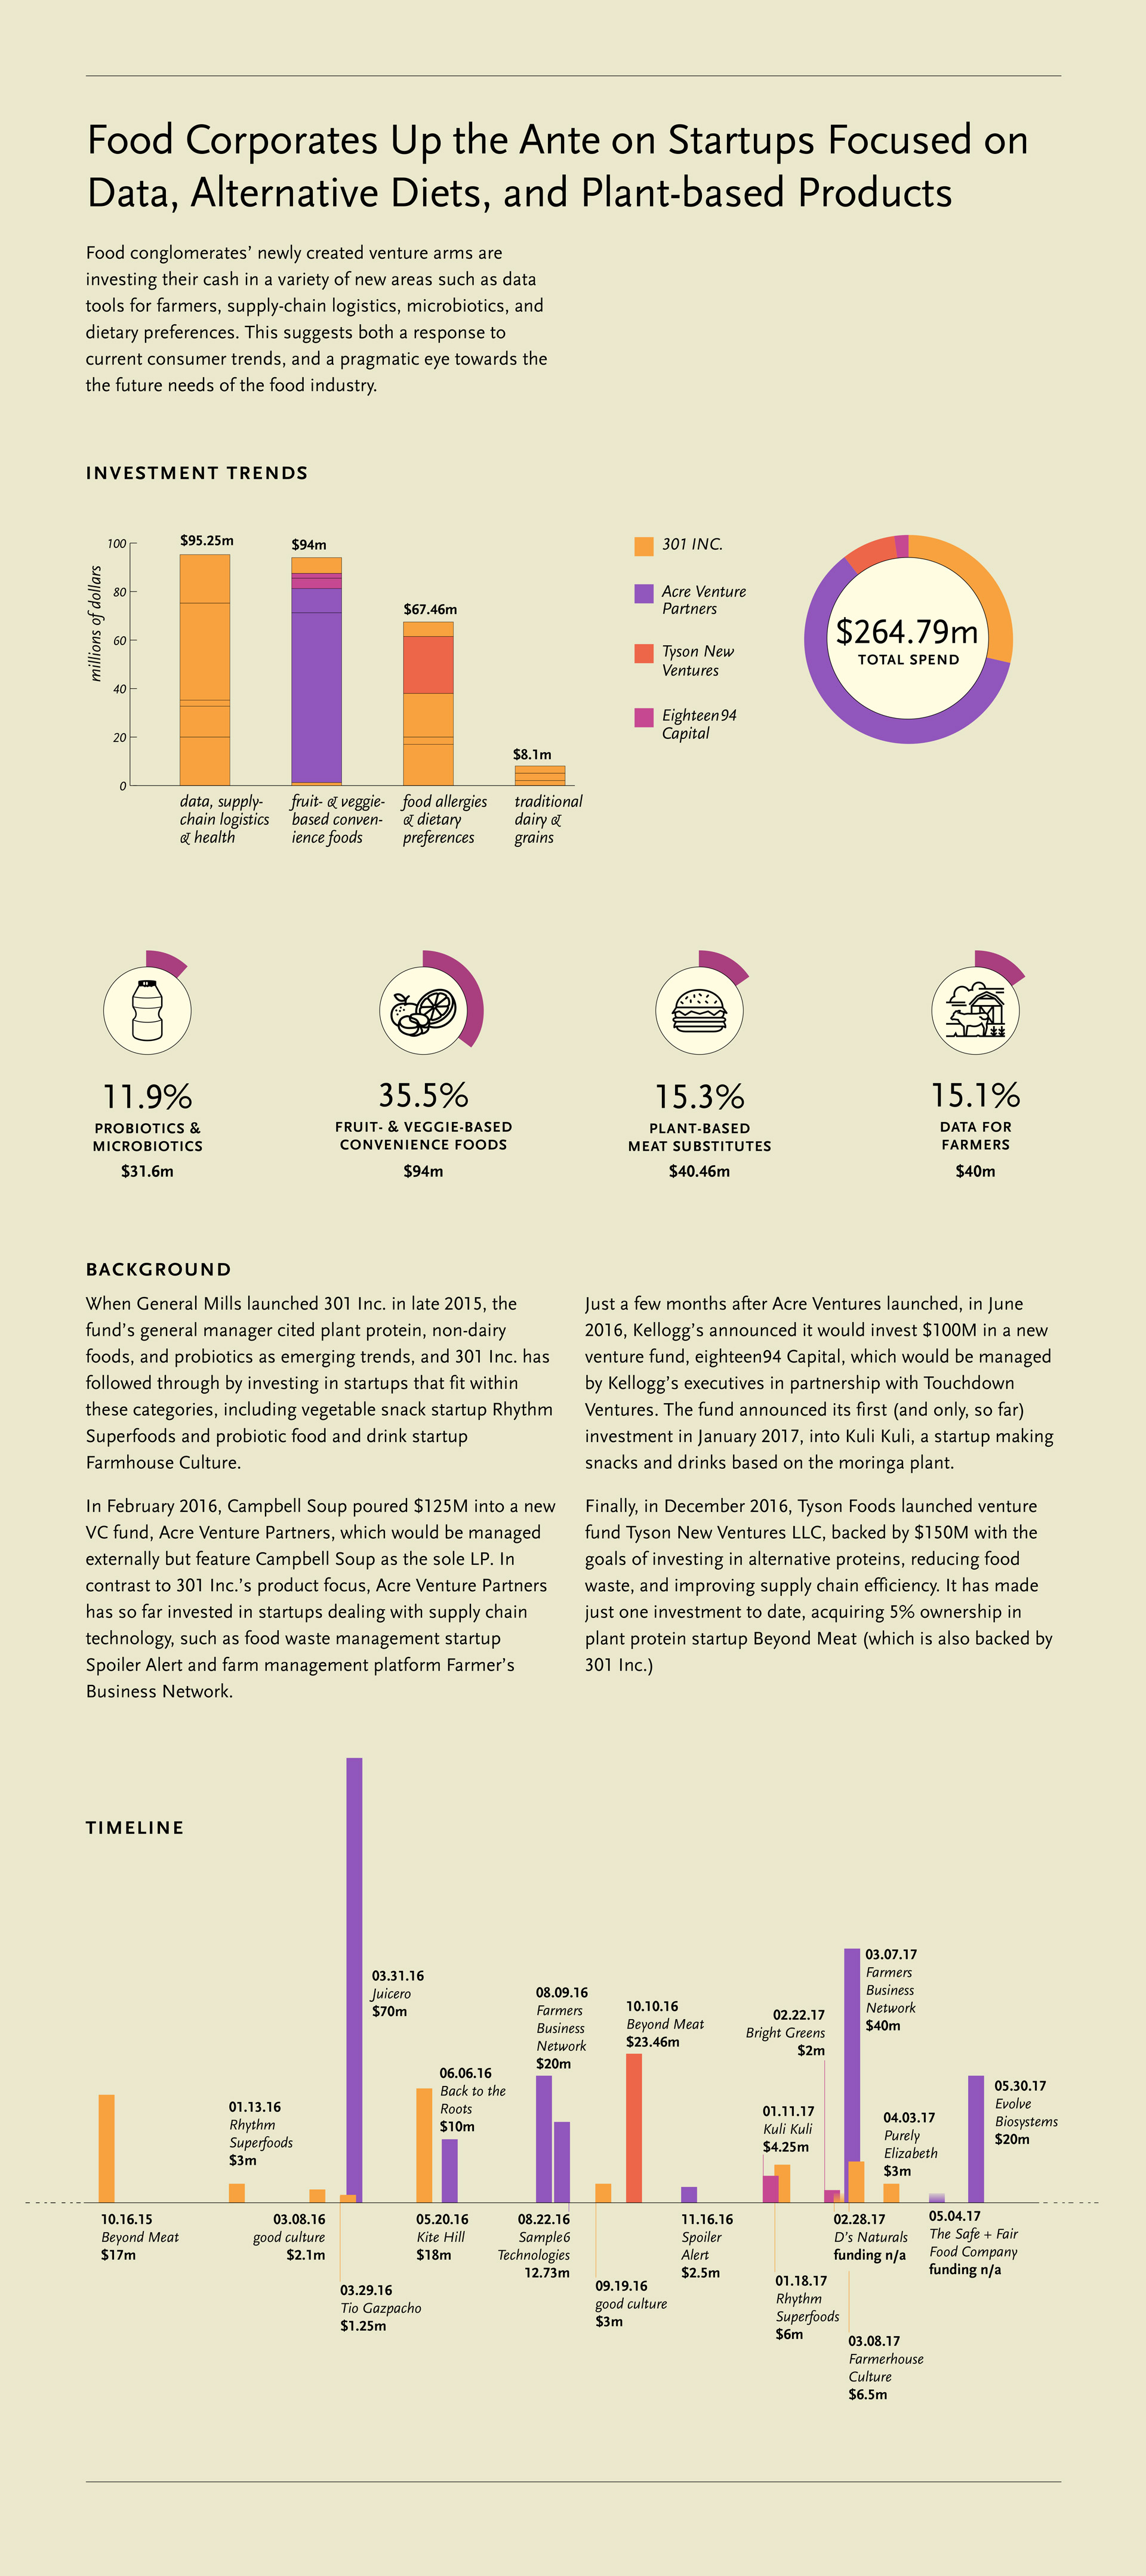
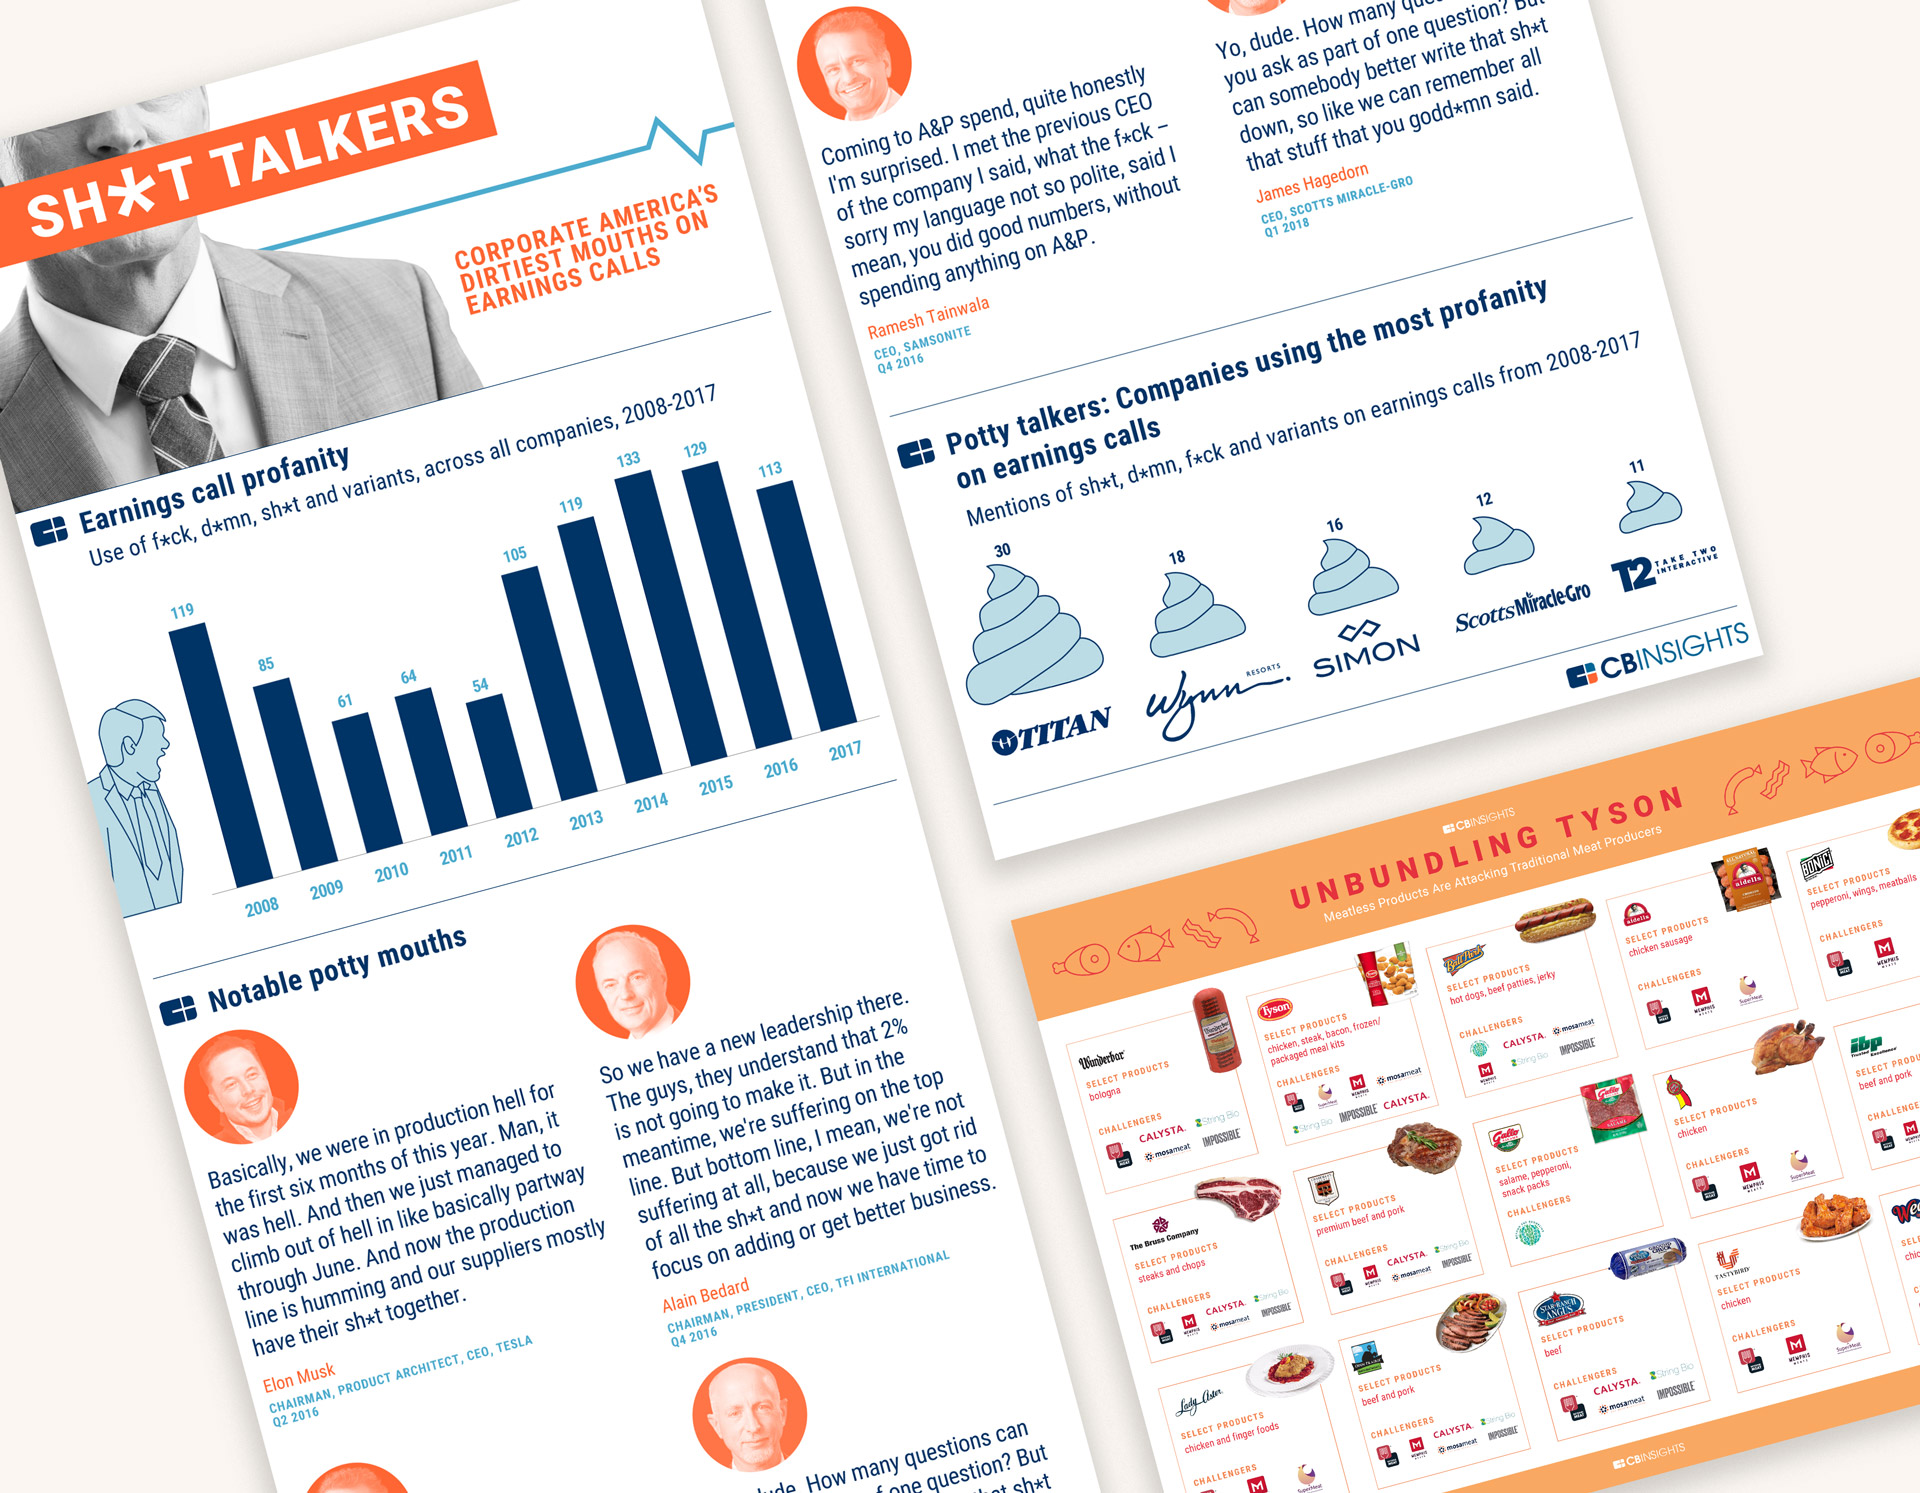
editorial data vis about "The Future of Food":
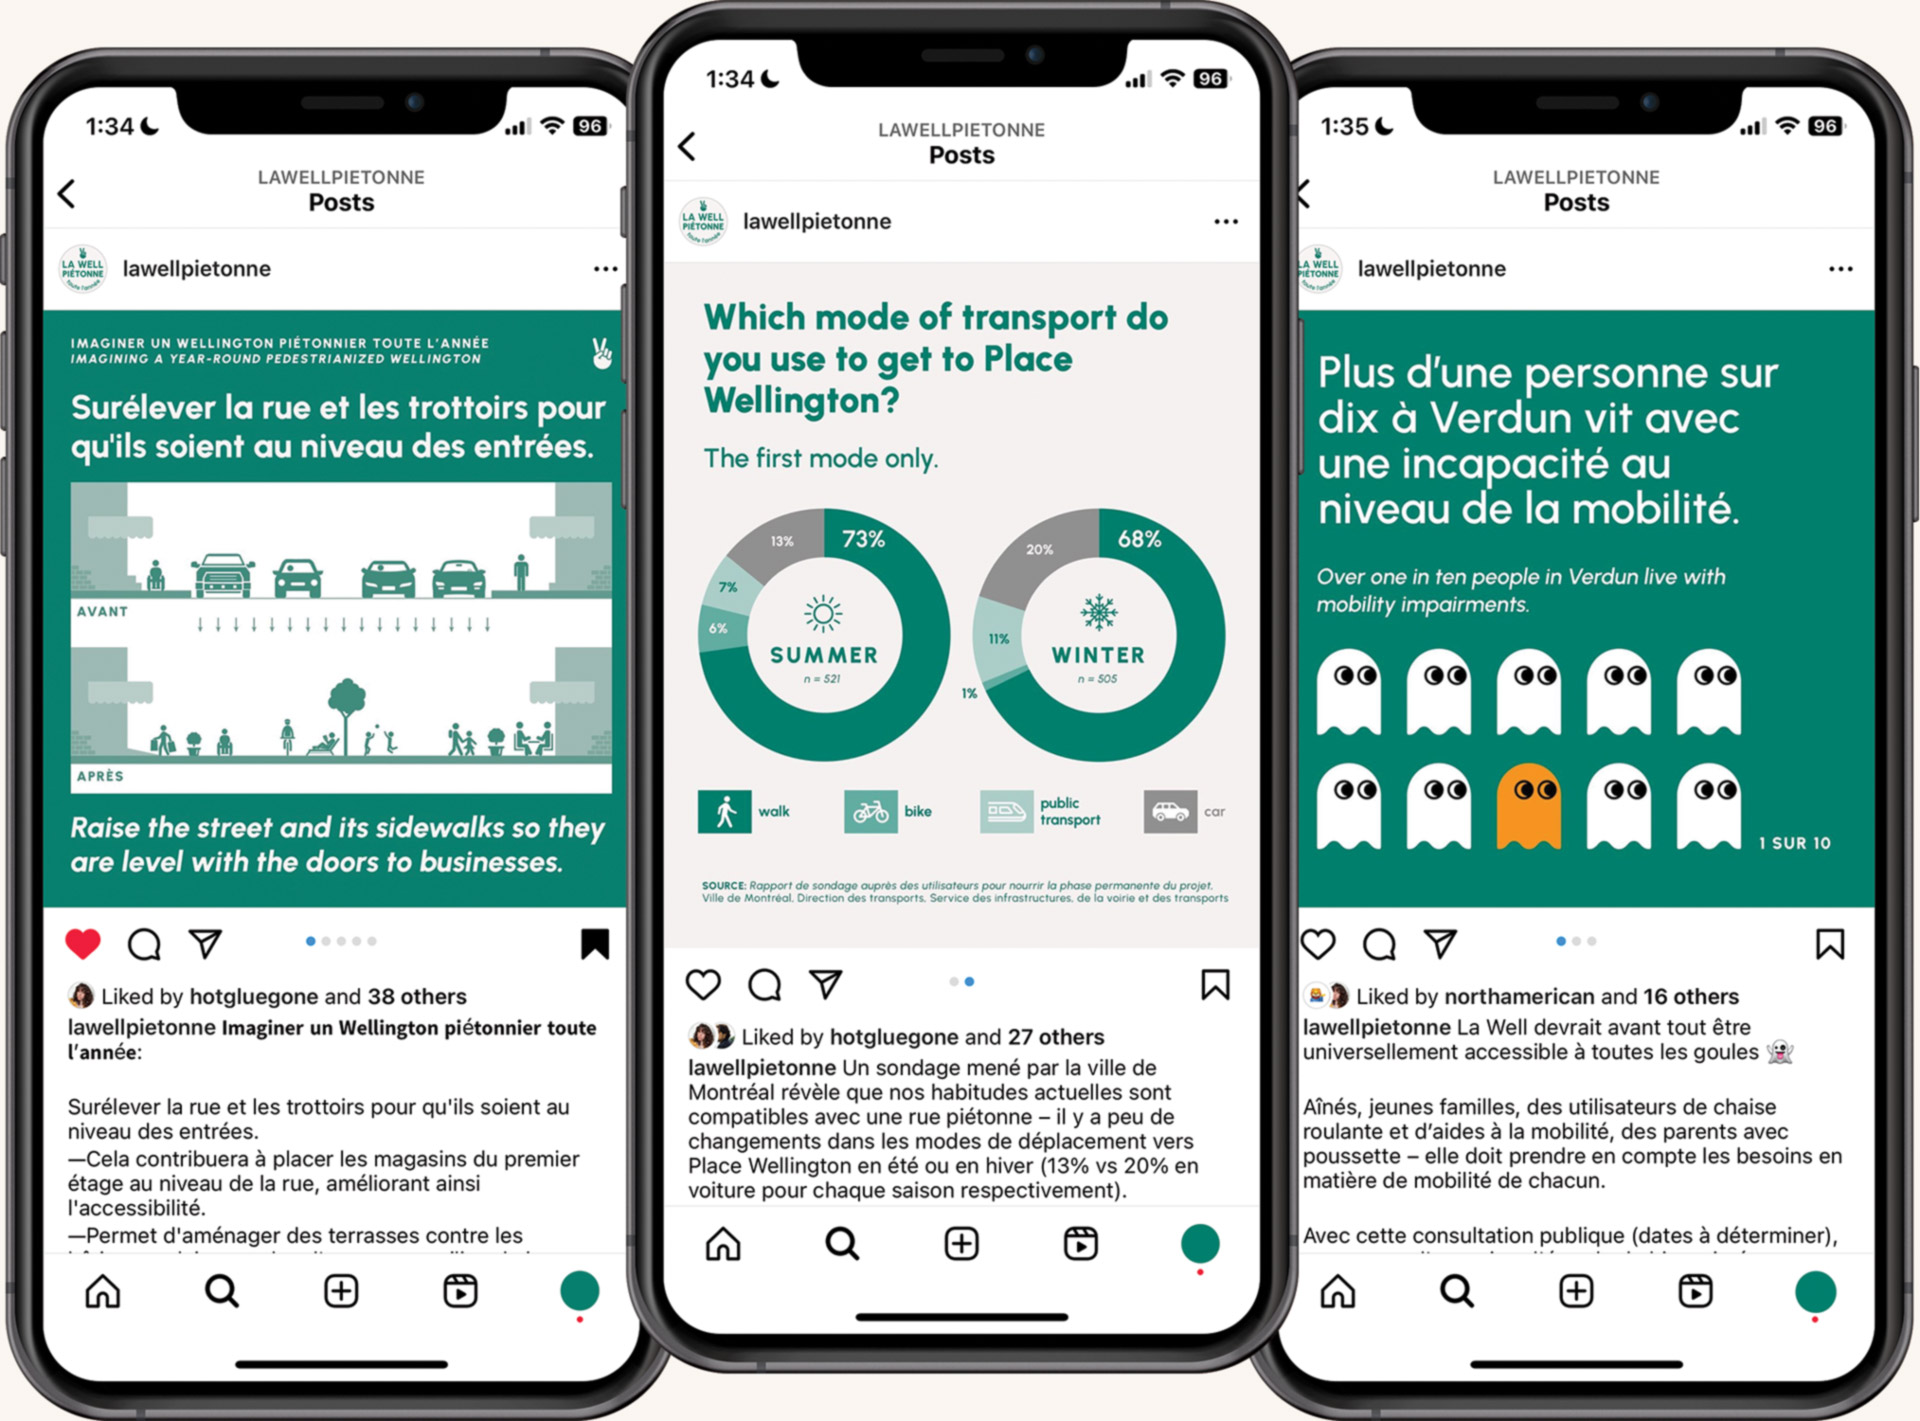
social media posts for a community initiative (personal project):
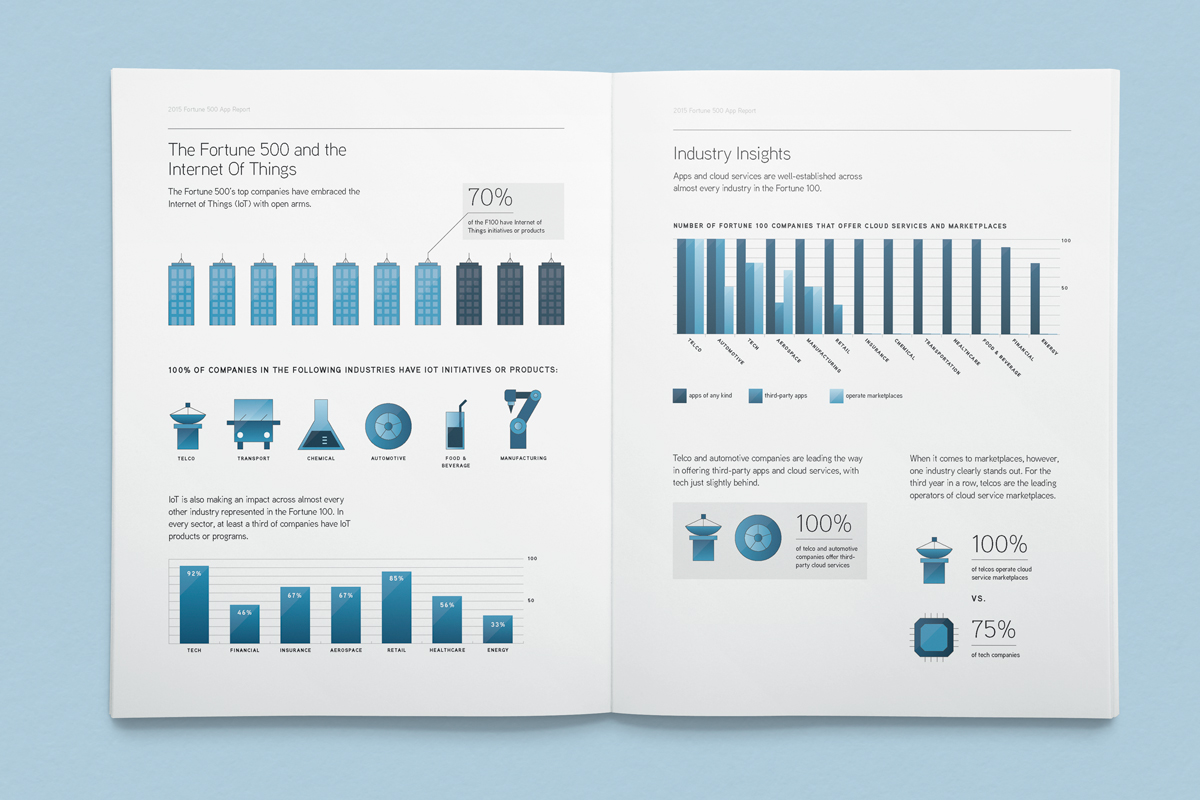
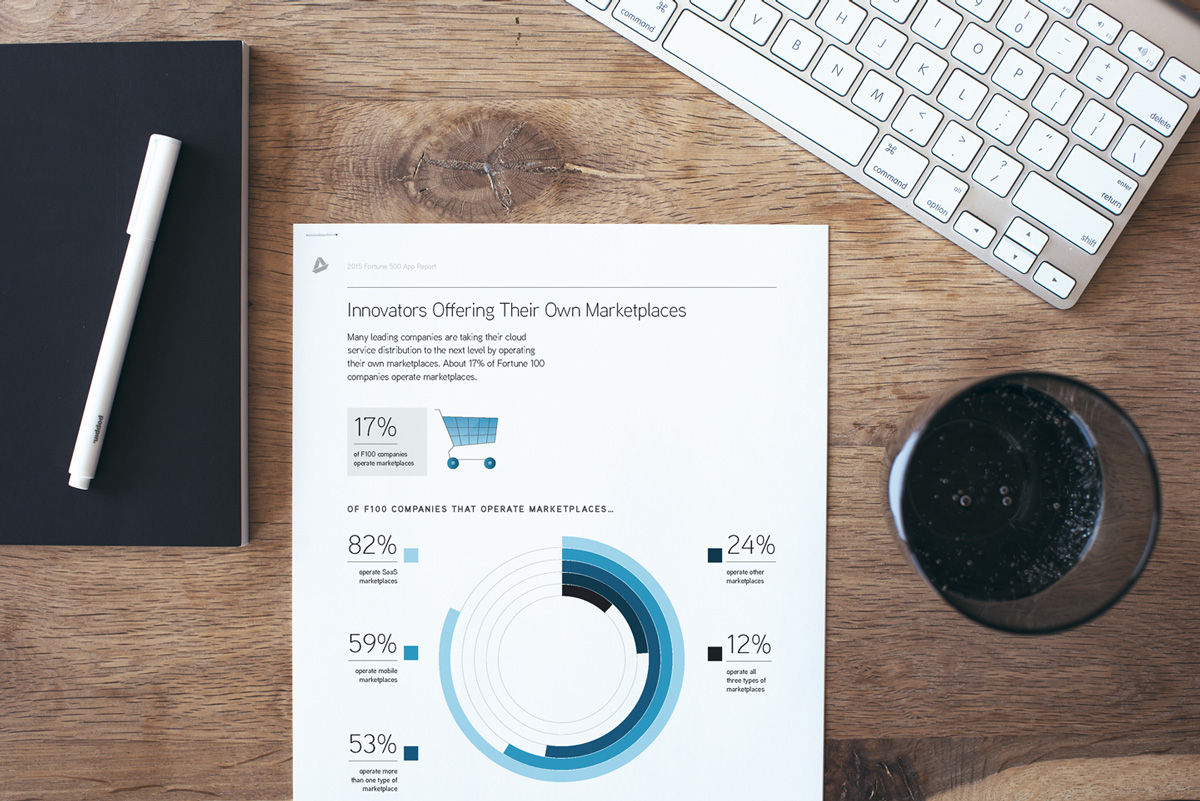
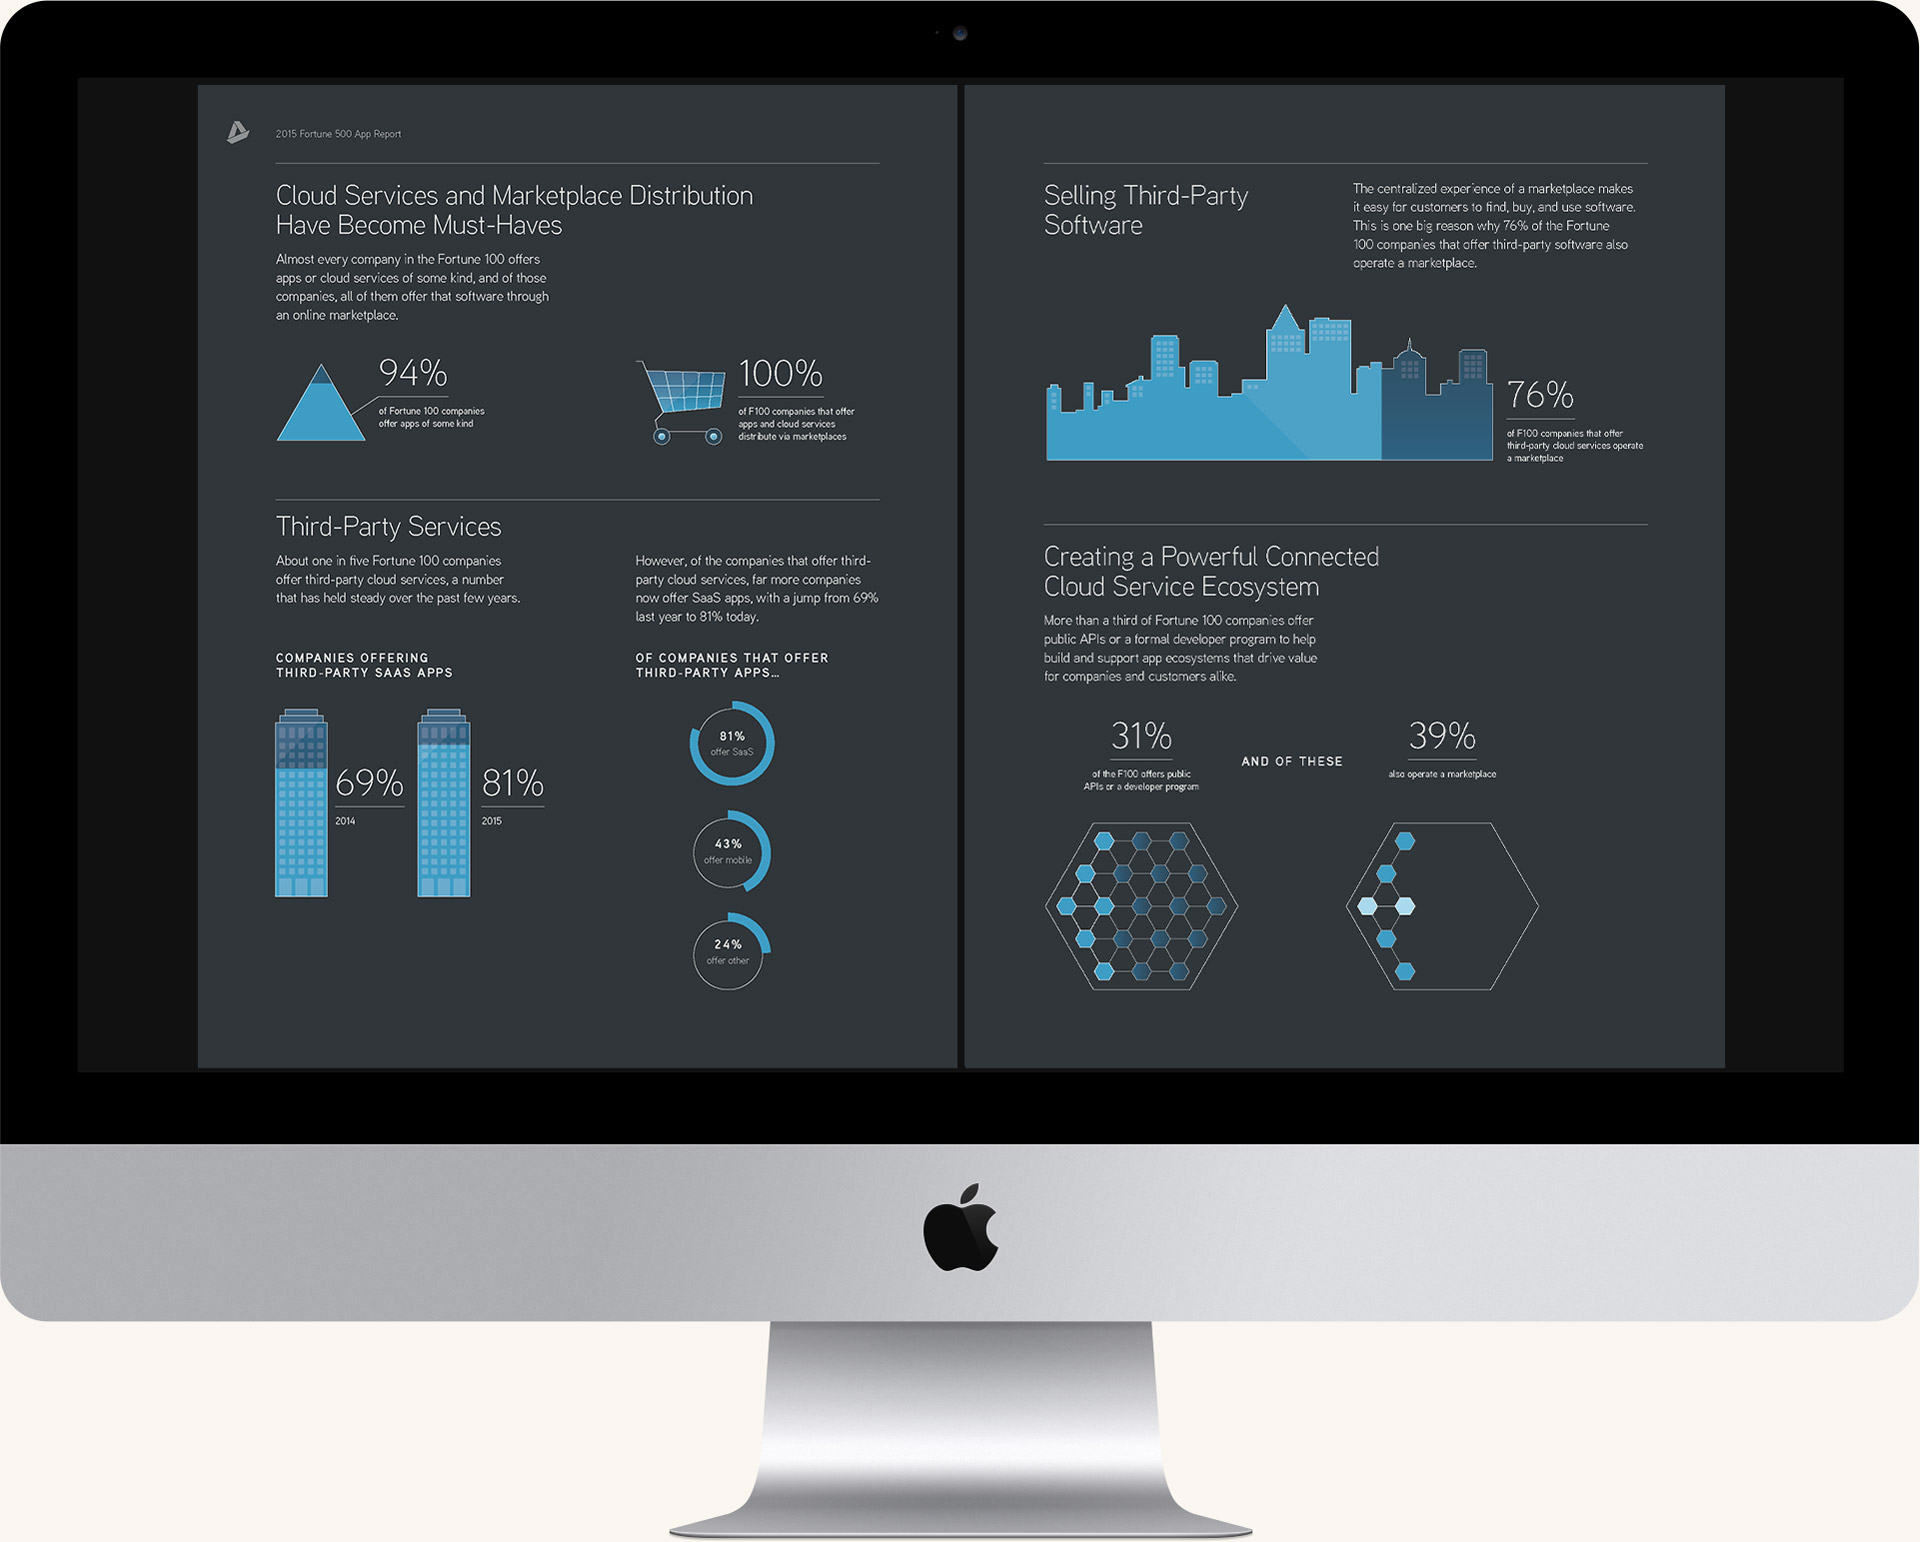
data visualization report explaining how Fortune 500 companies use the "Internet of Things":
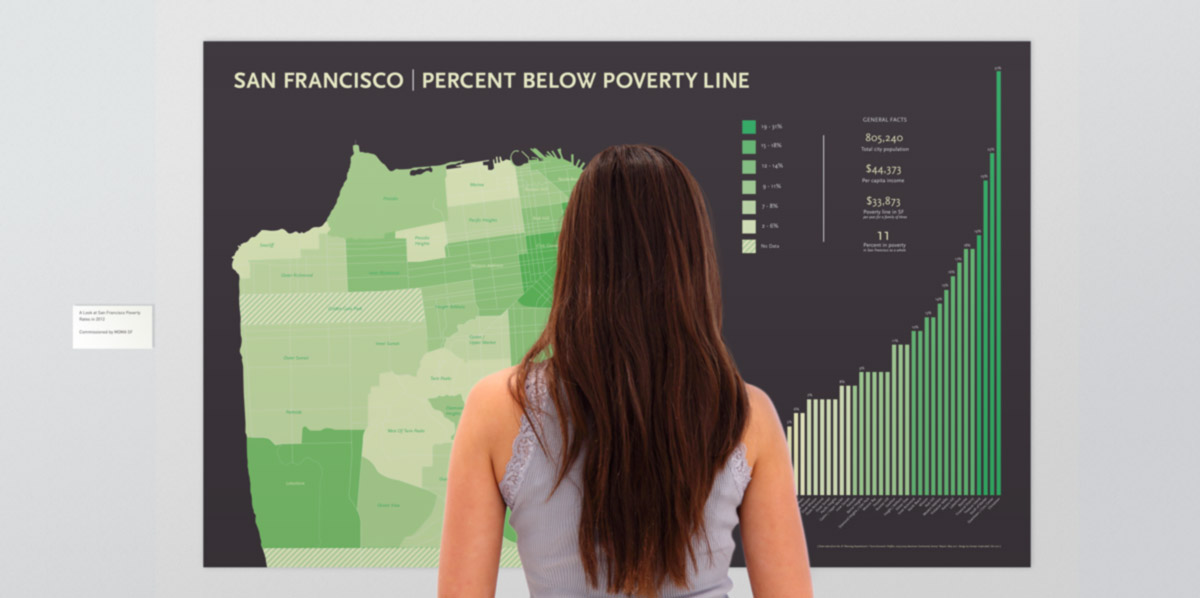
illuminating poverty statistics in San Francisco (personal project):
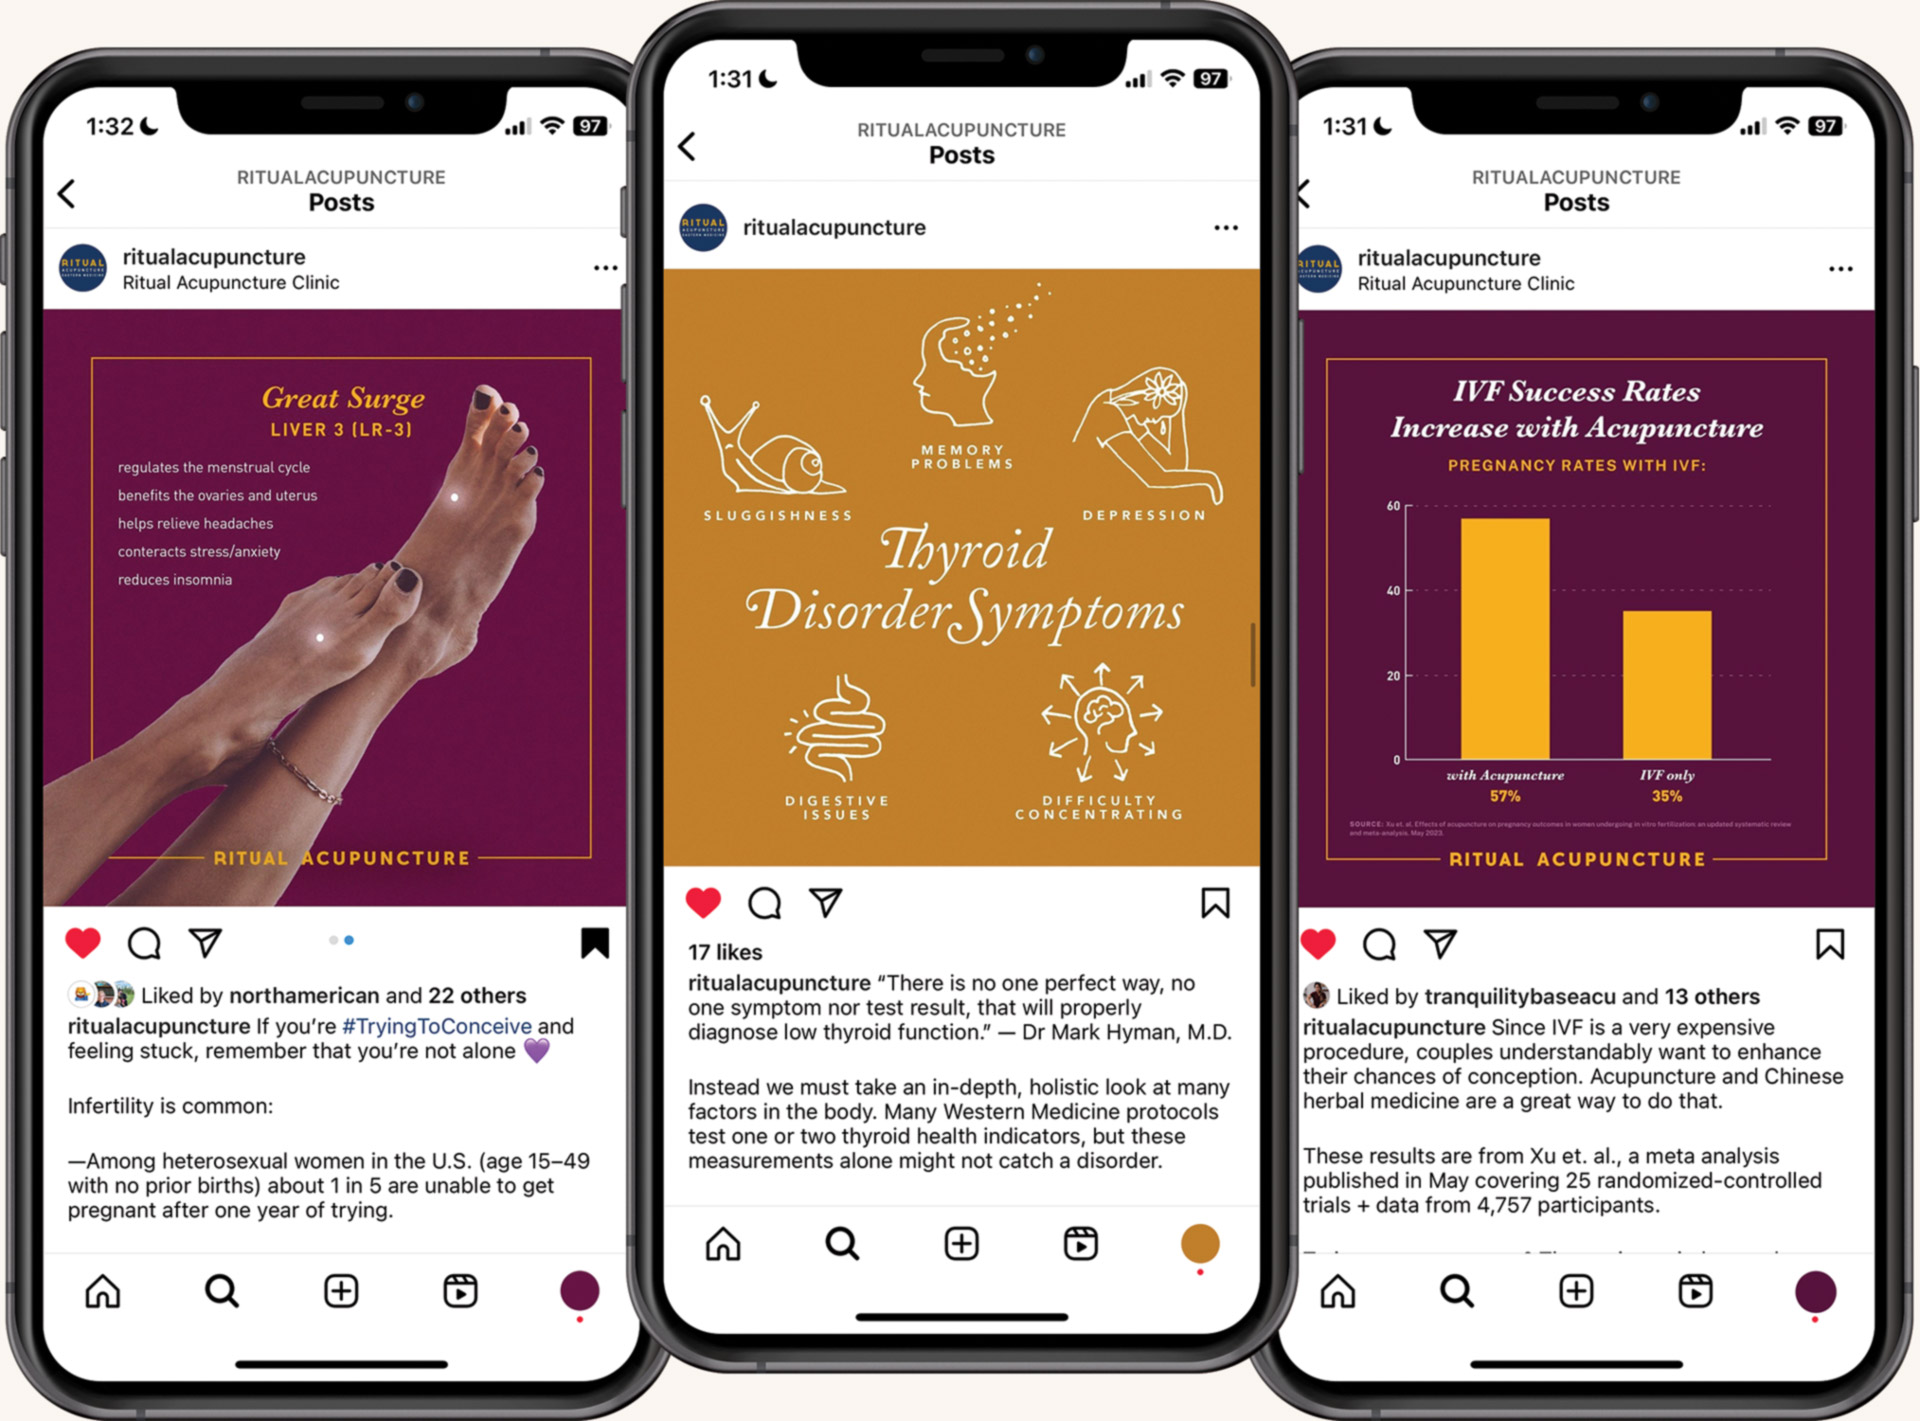
social media posts for an acupuncture clinic:
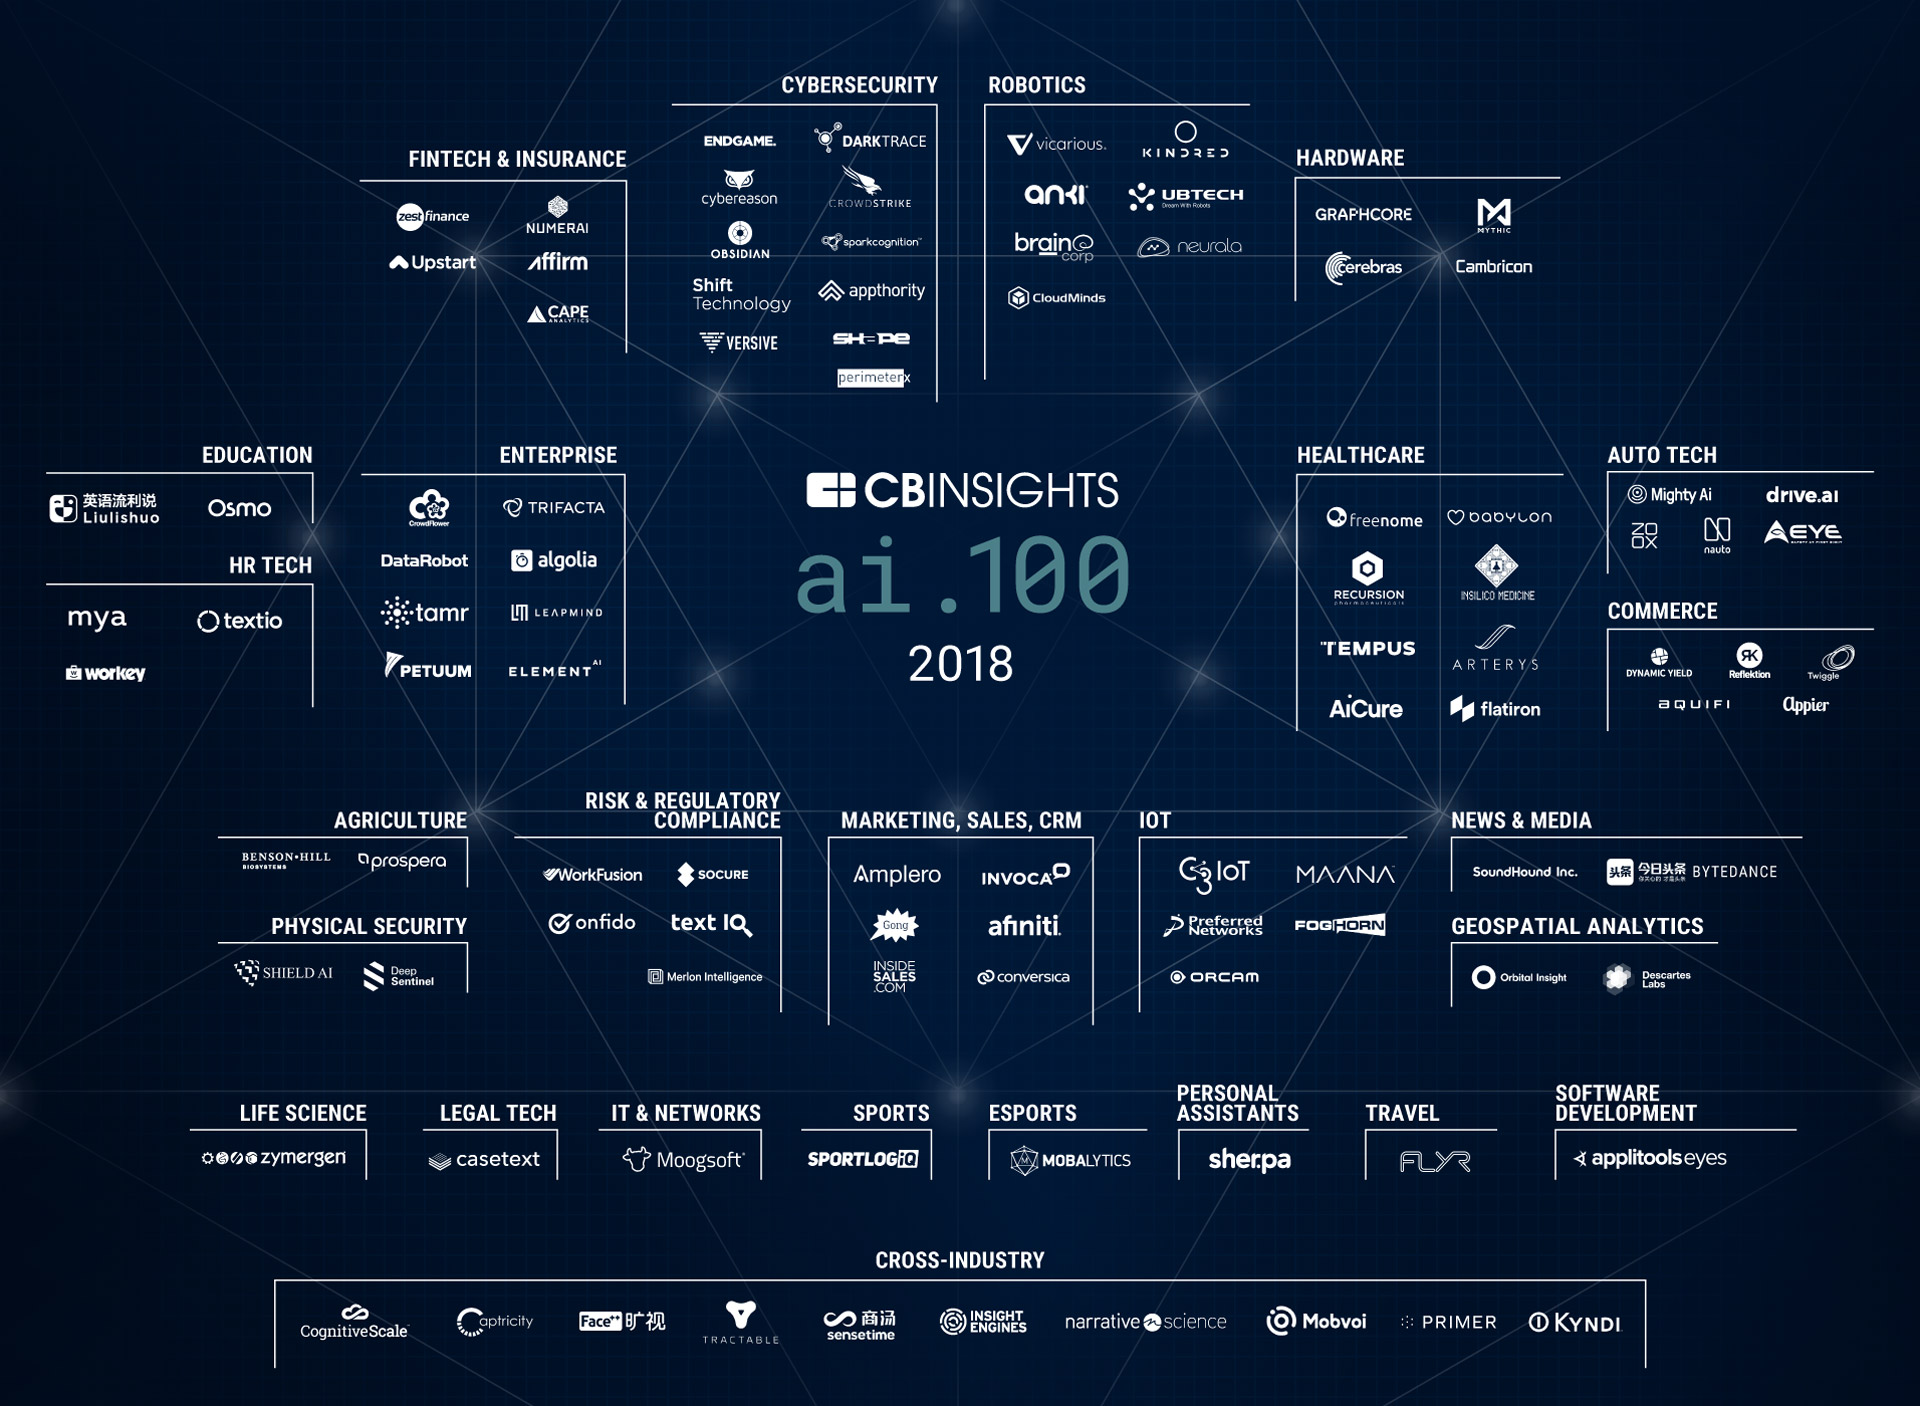
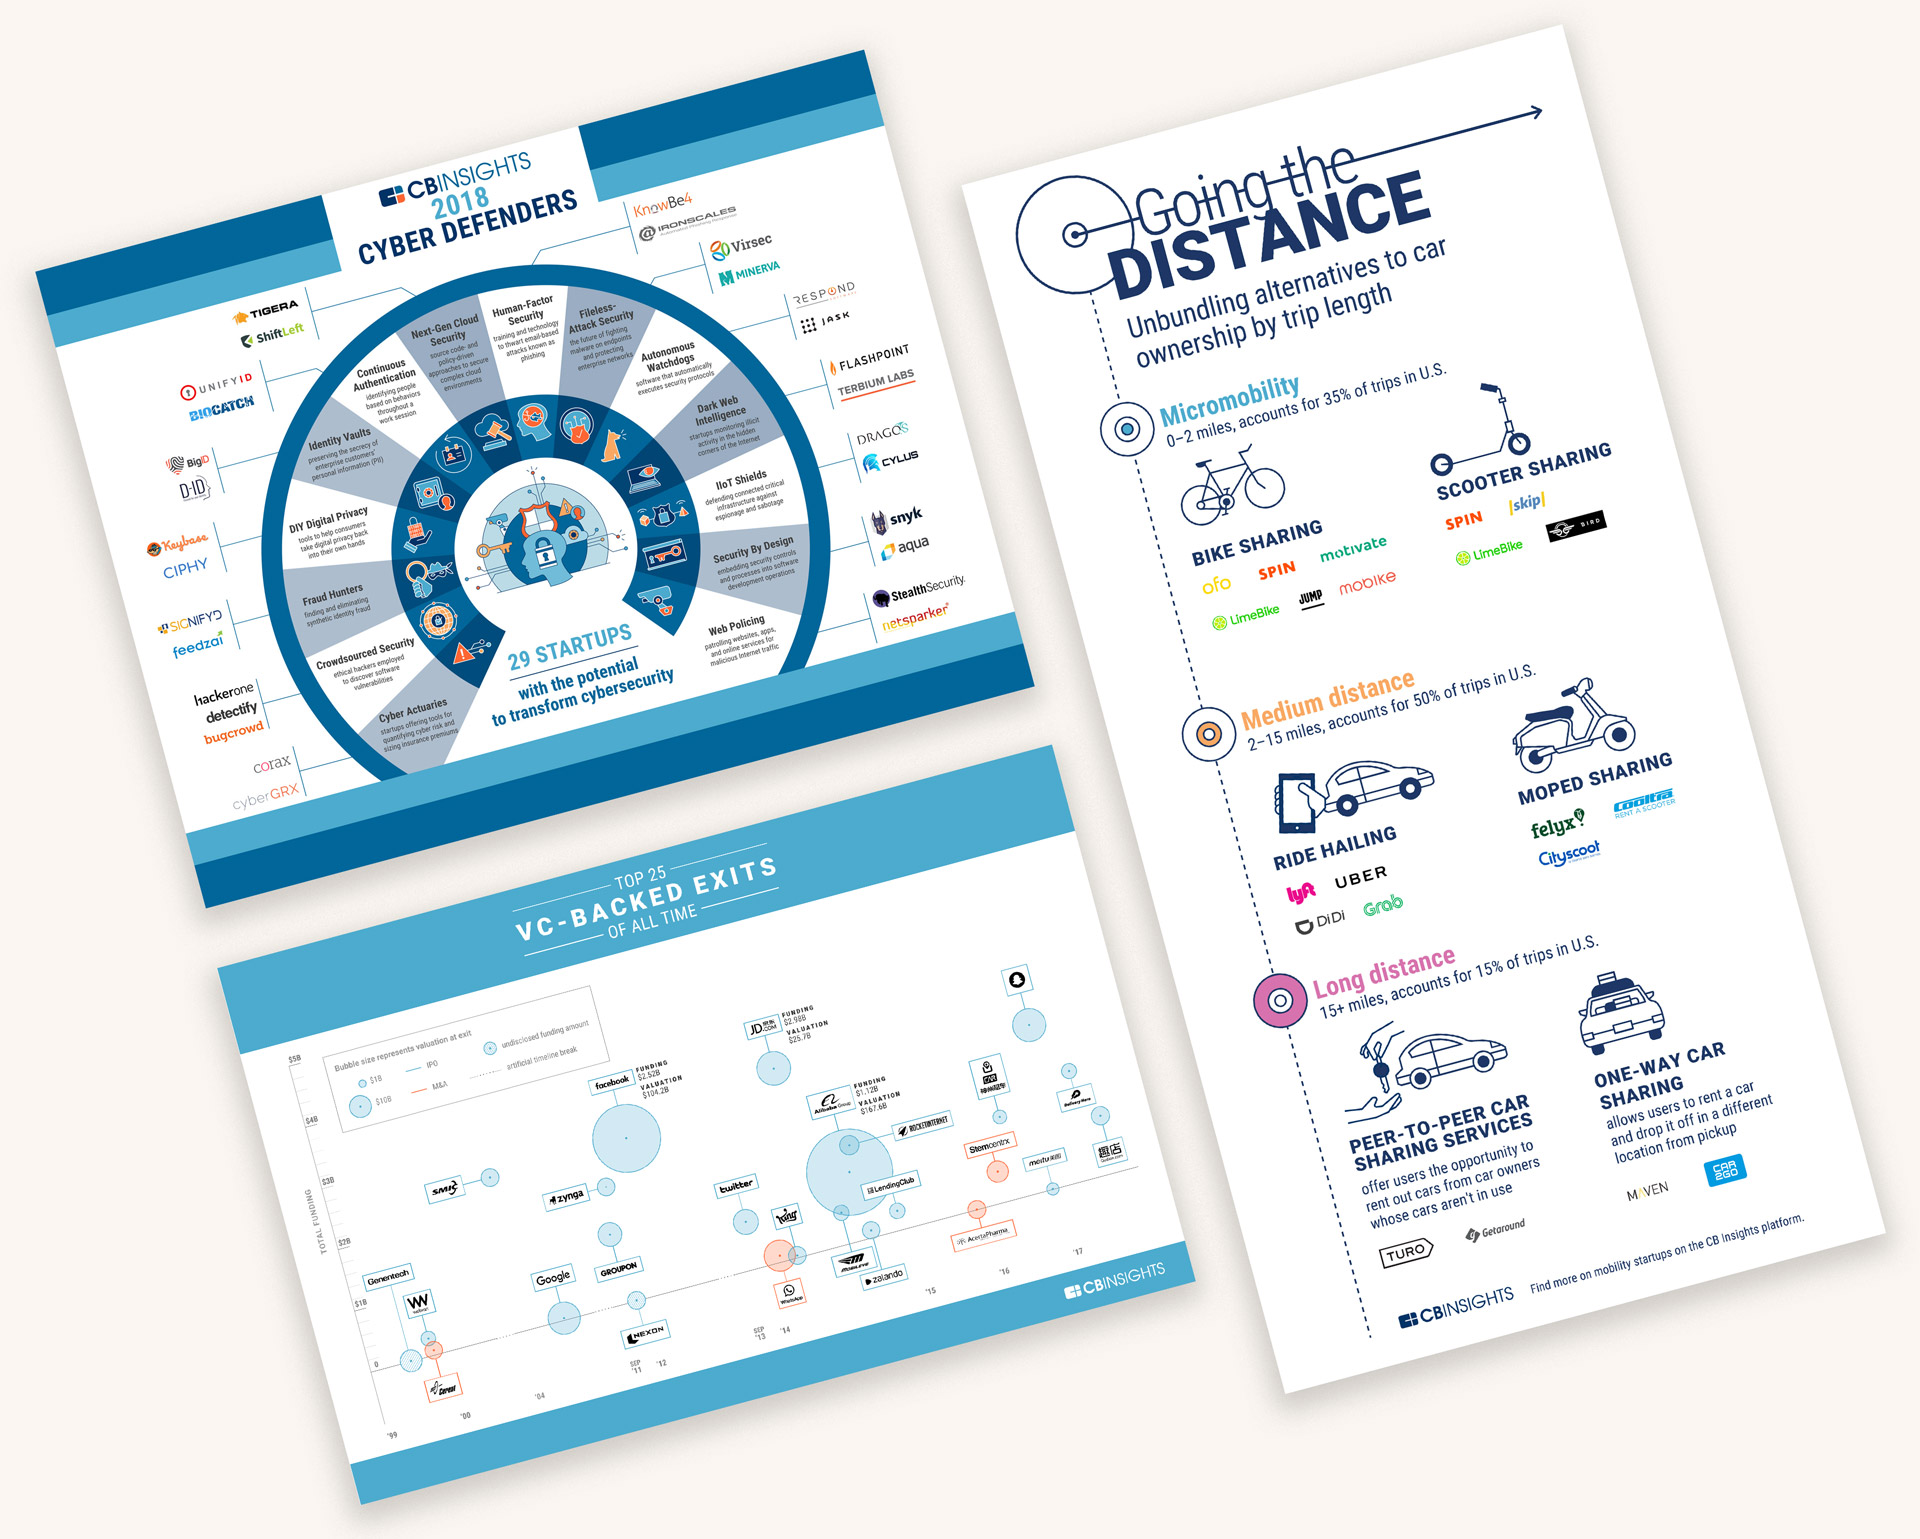
market map of innovative AI technology companies, 2018:
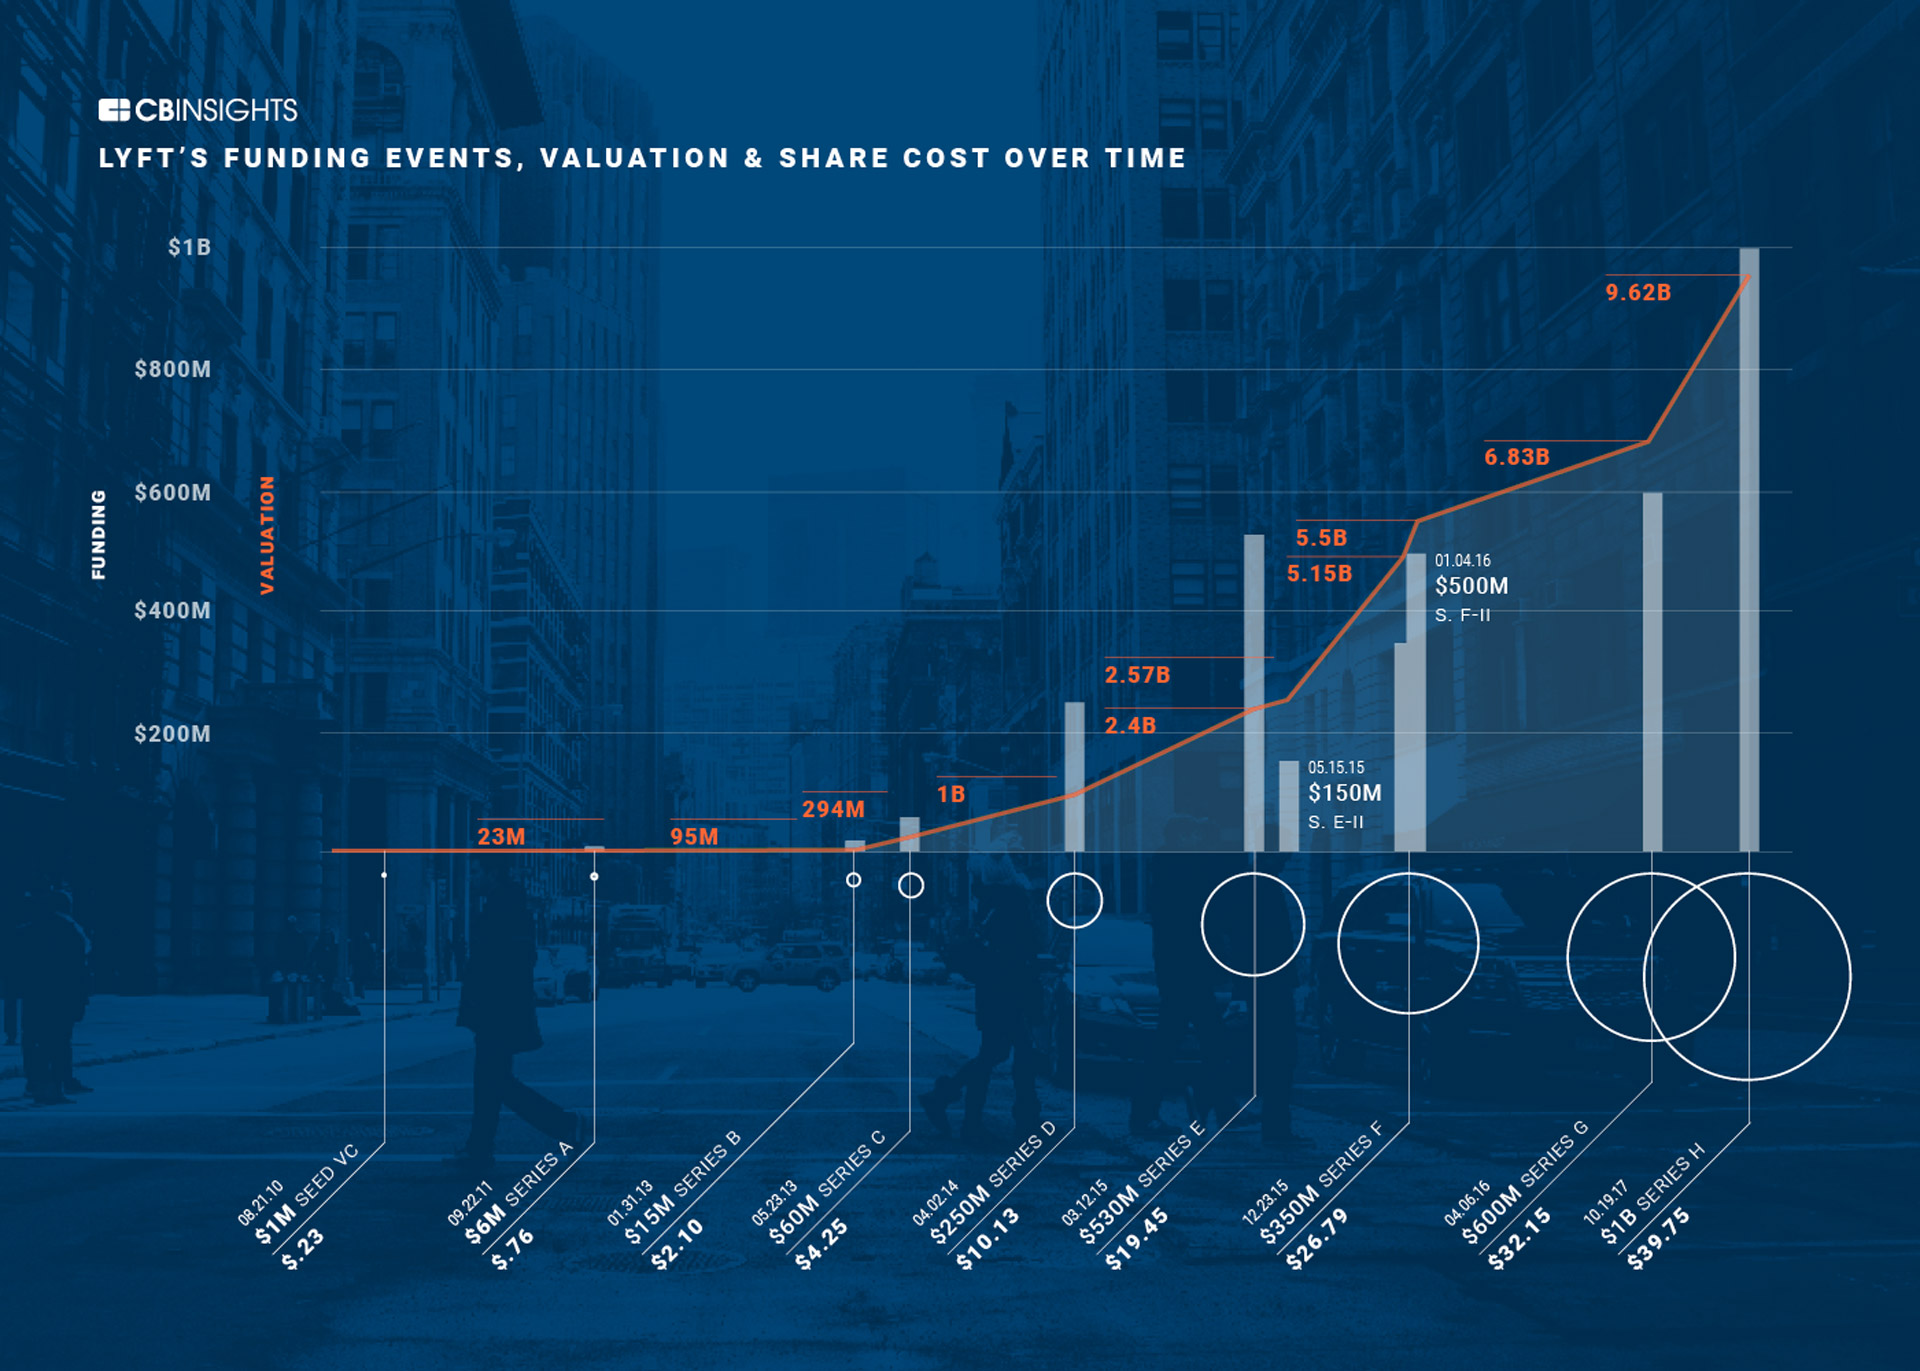
lyft funding over time:
other various data visualization and data storytelling projects:
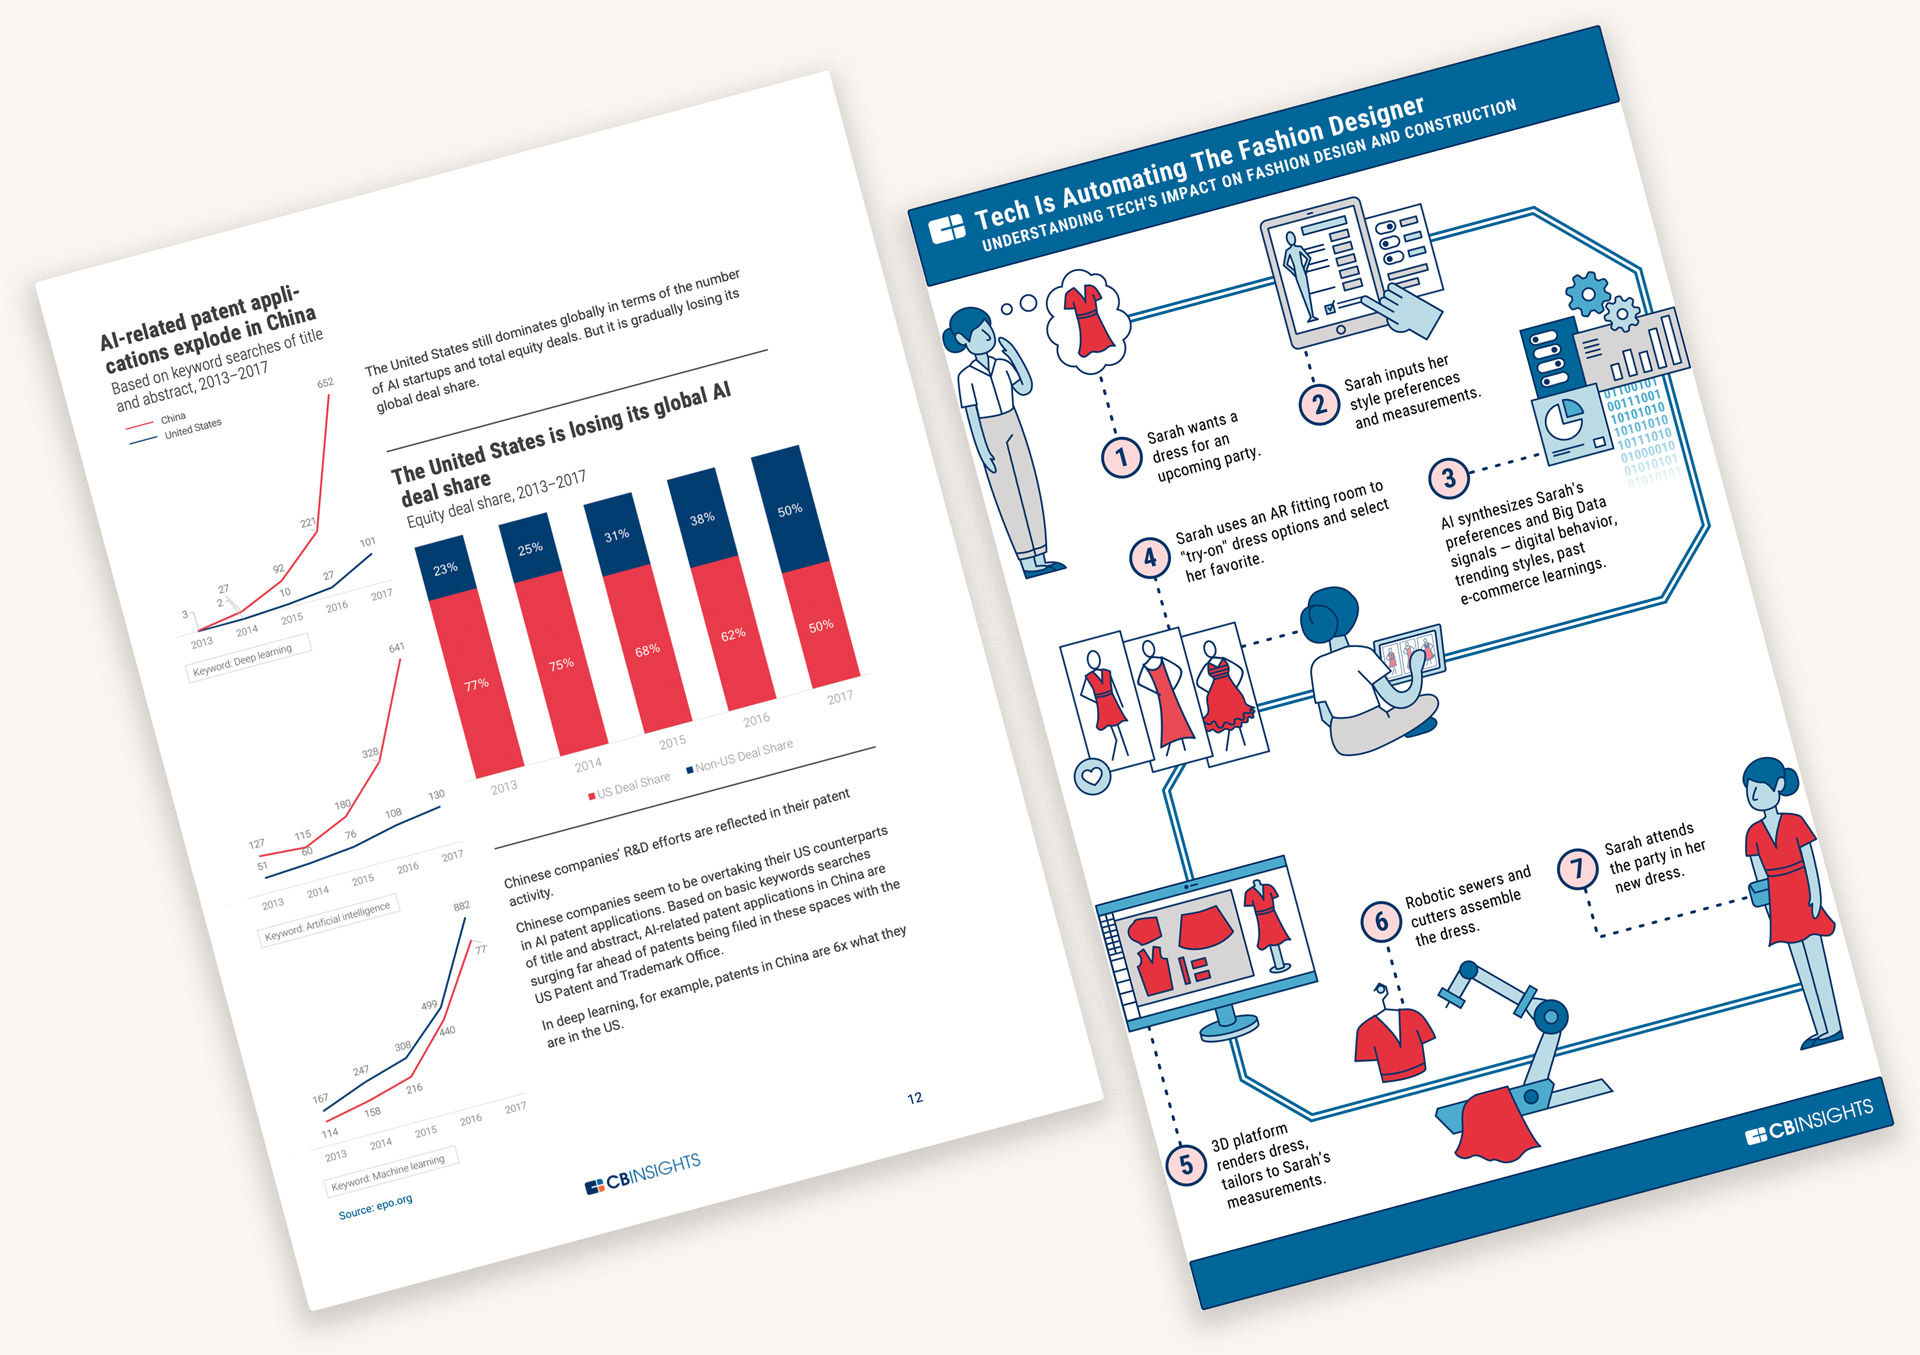
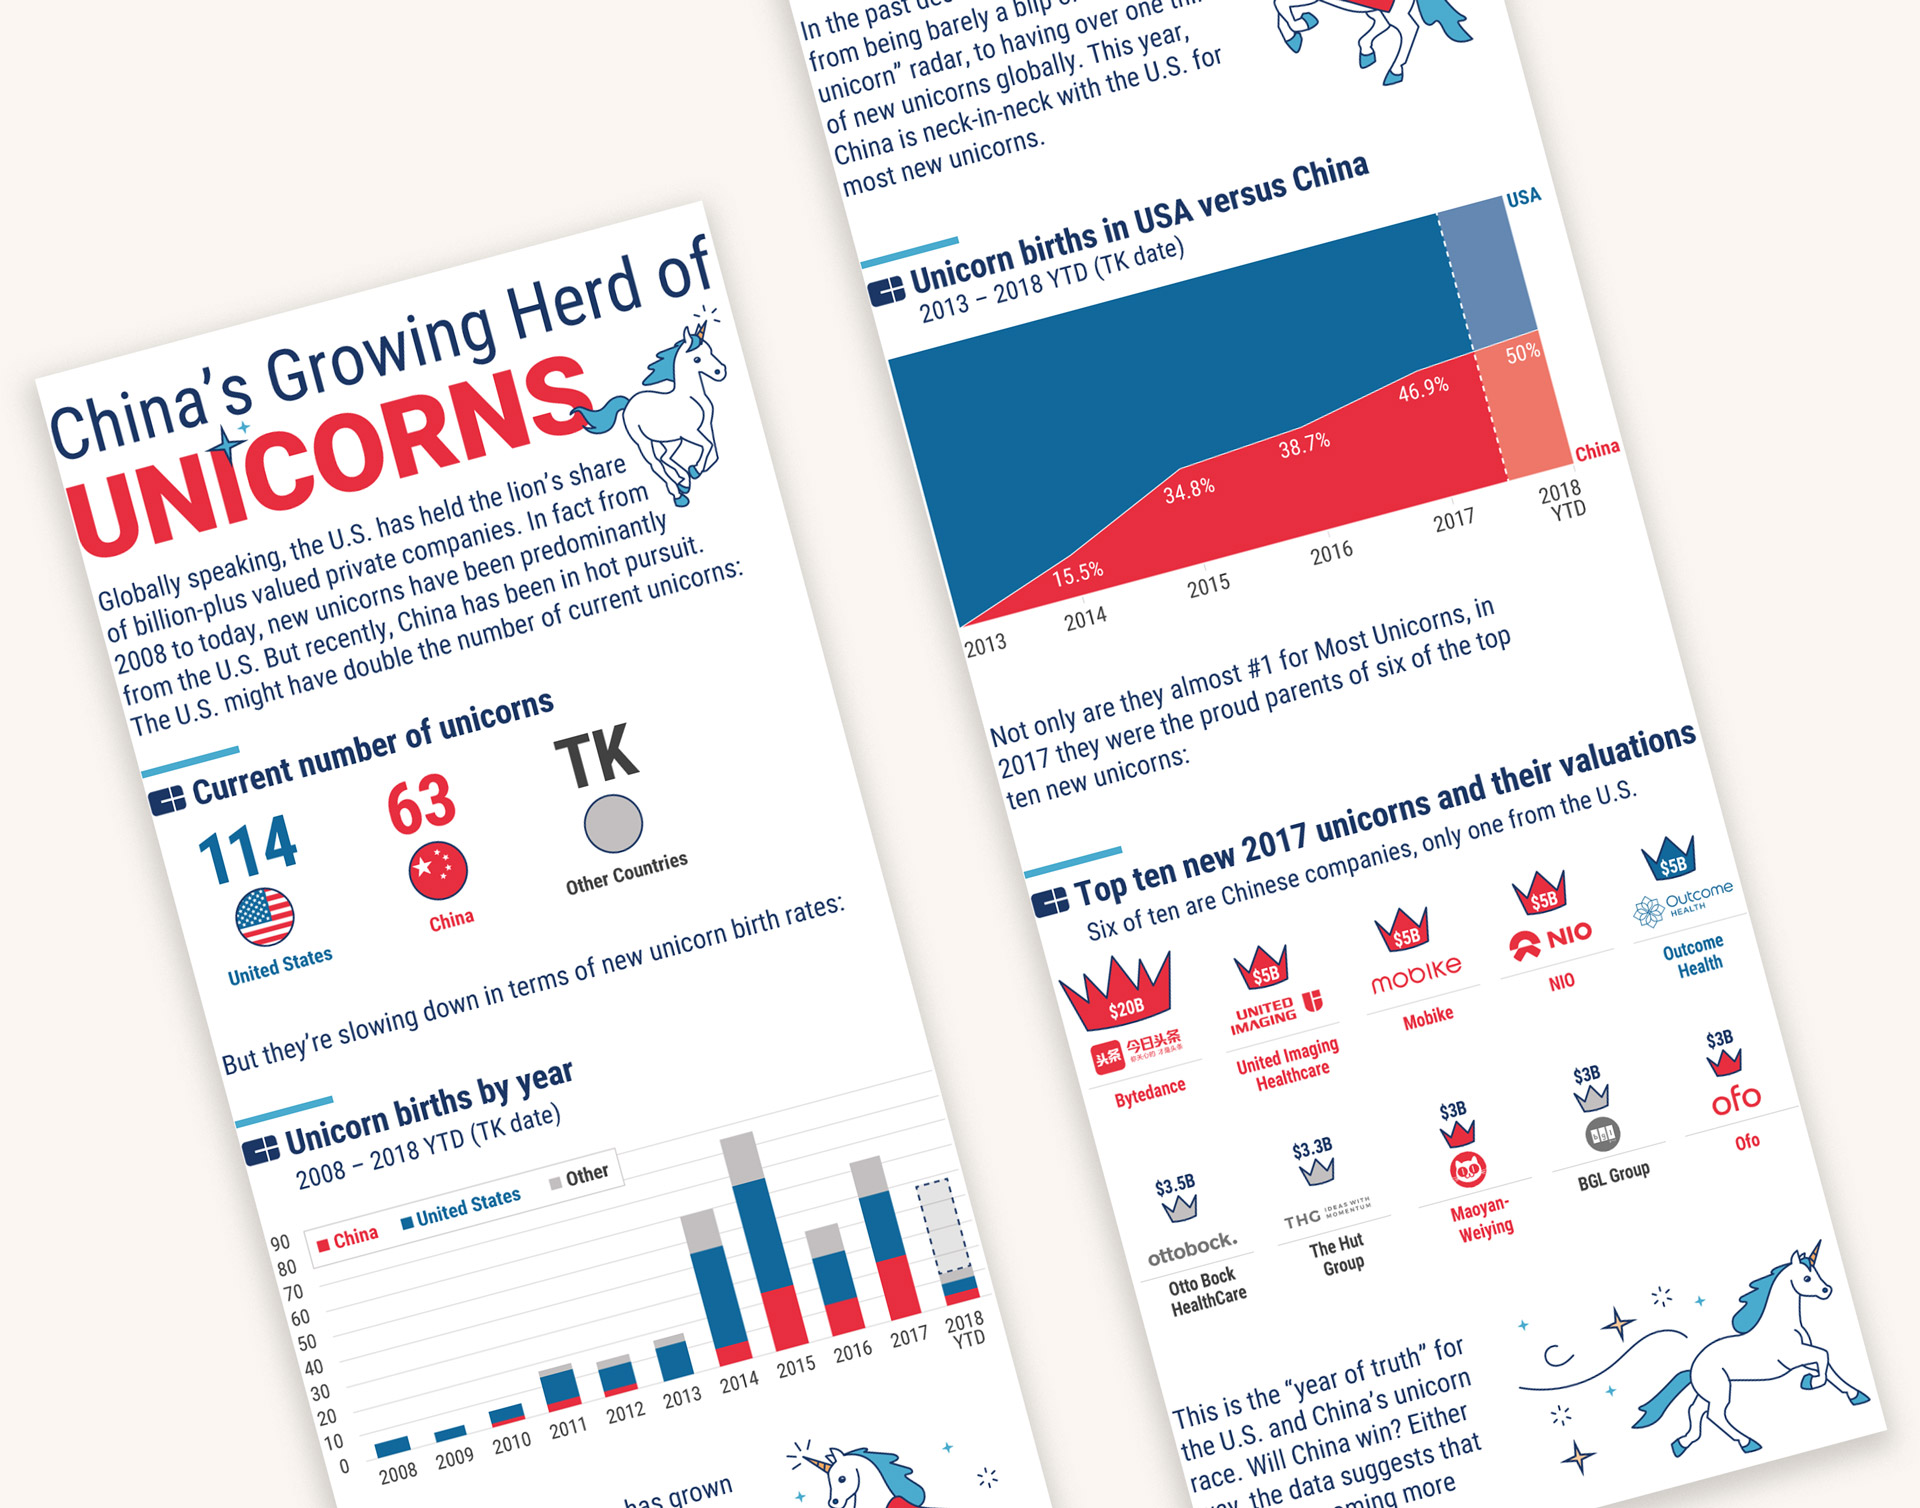
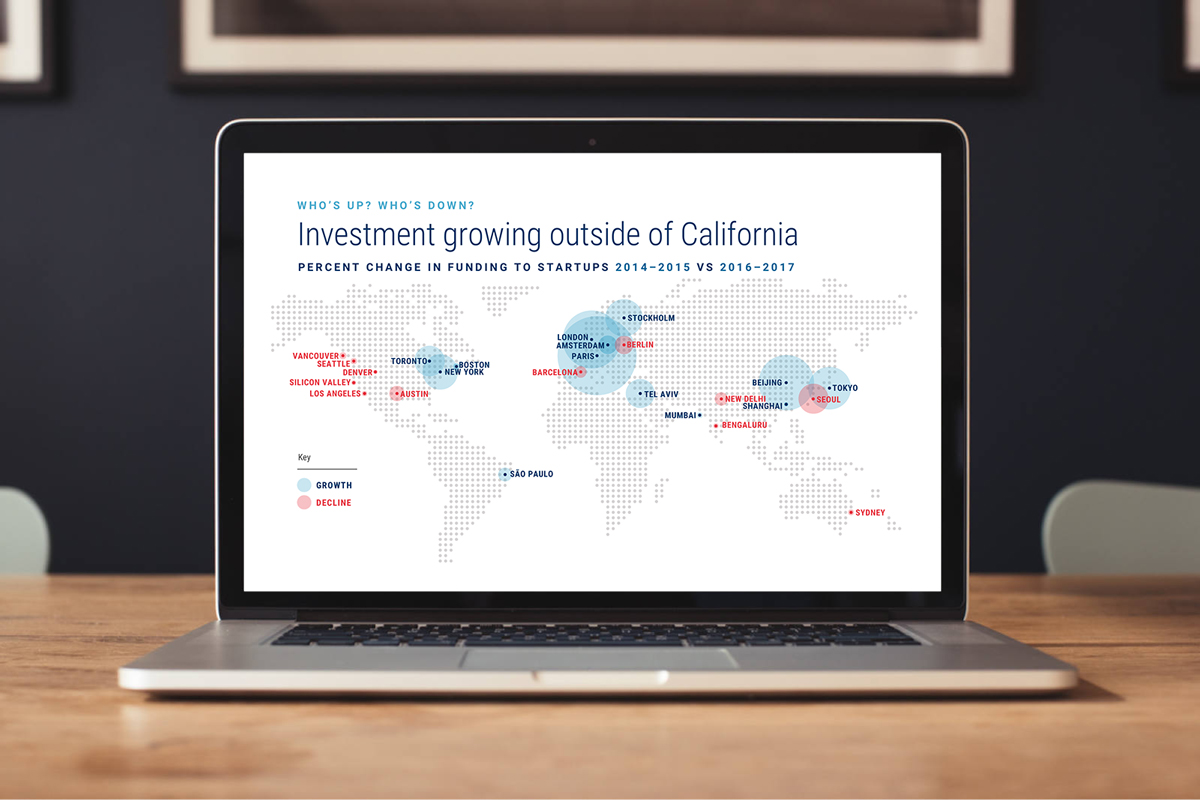
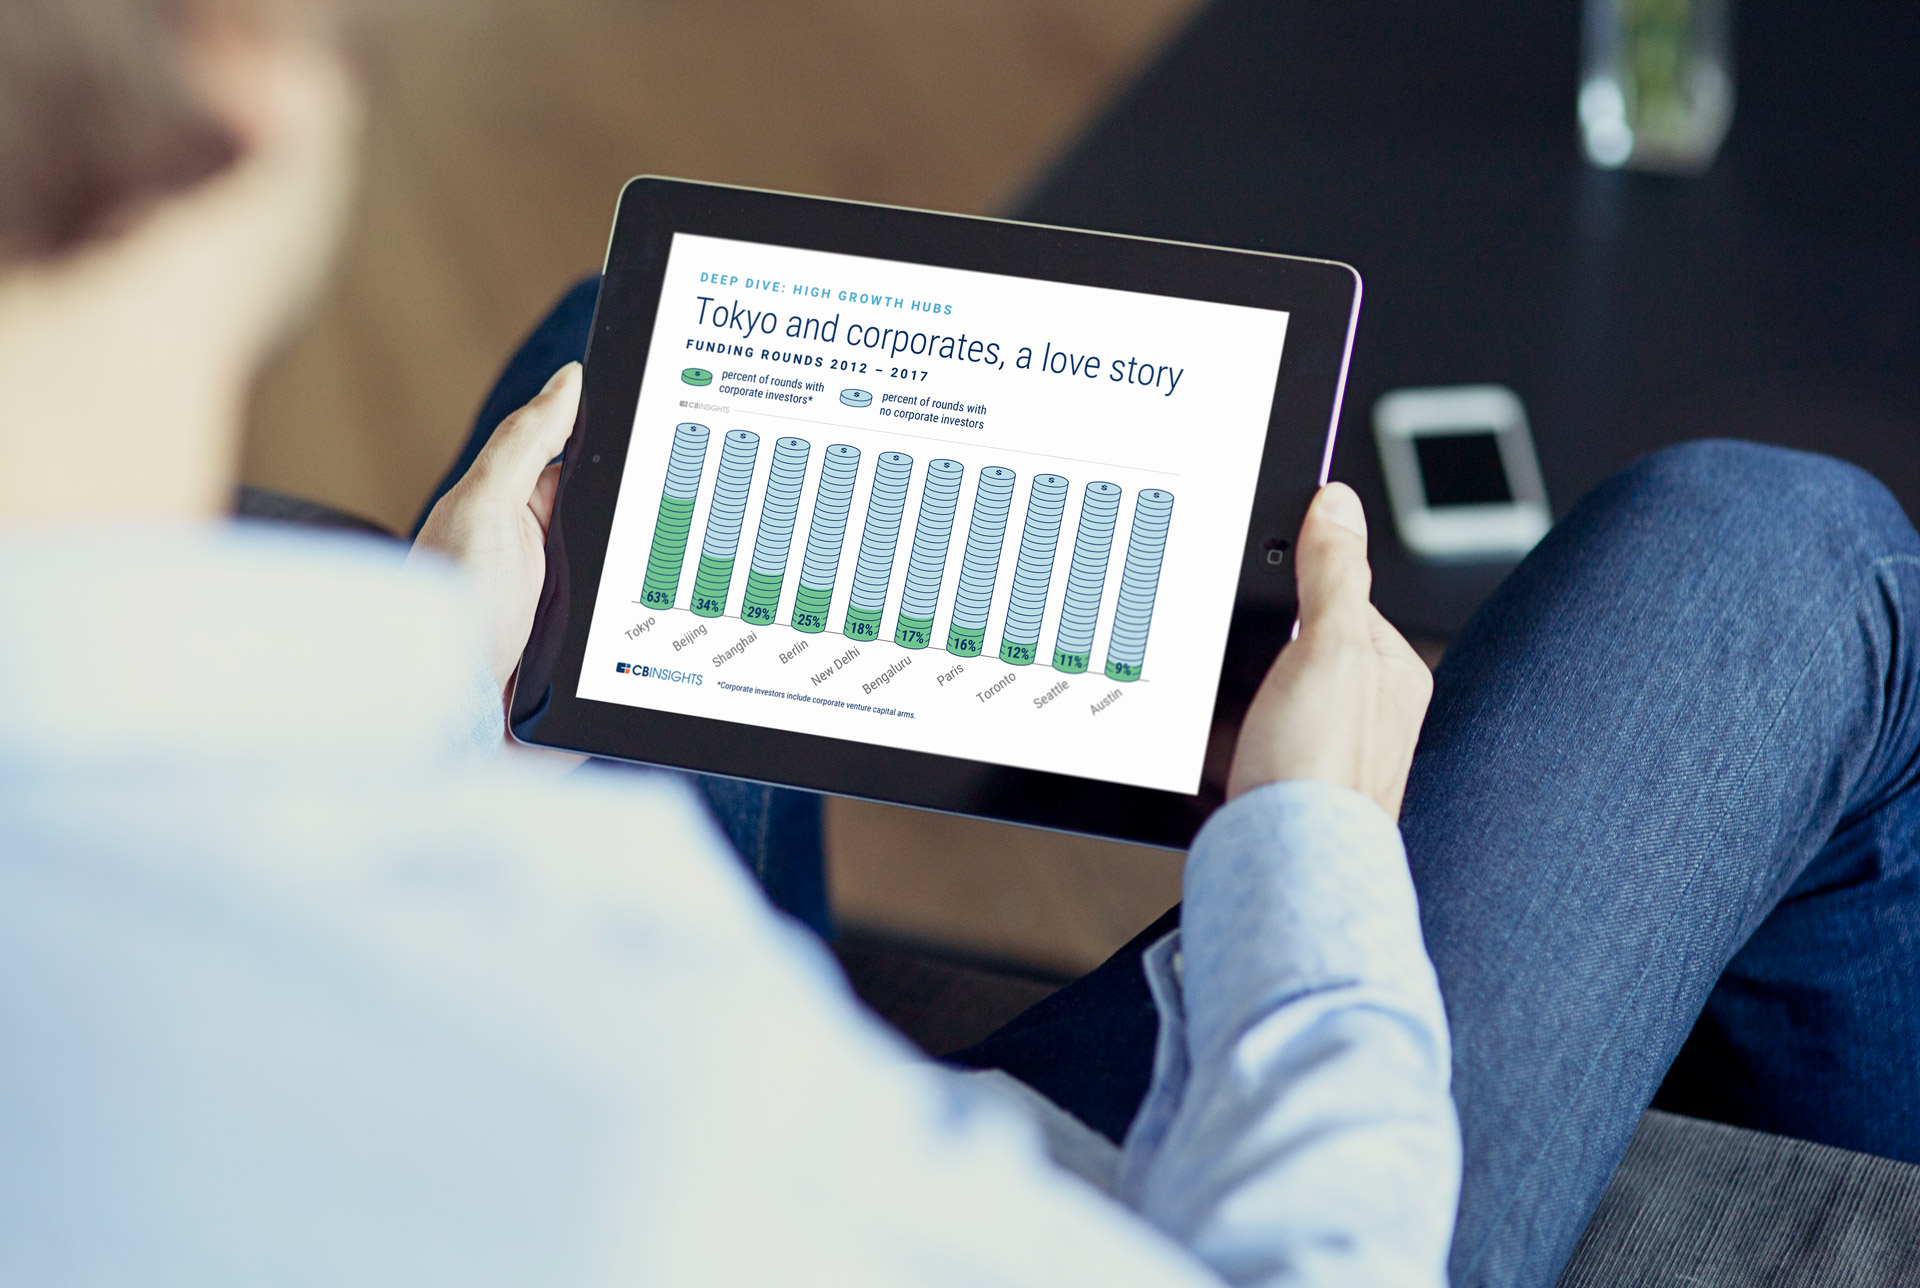
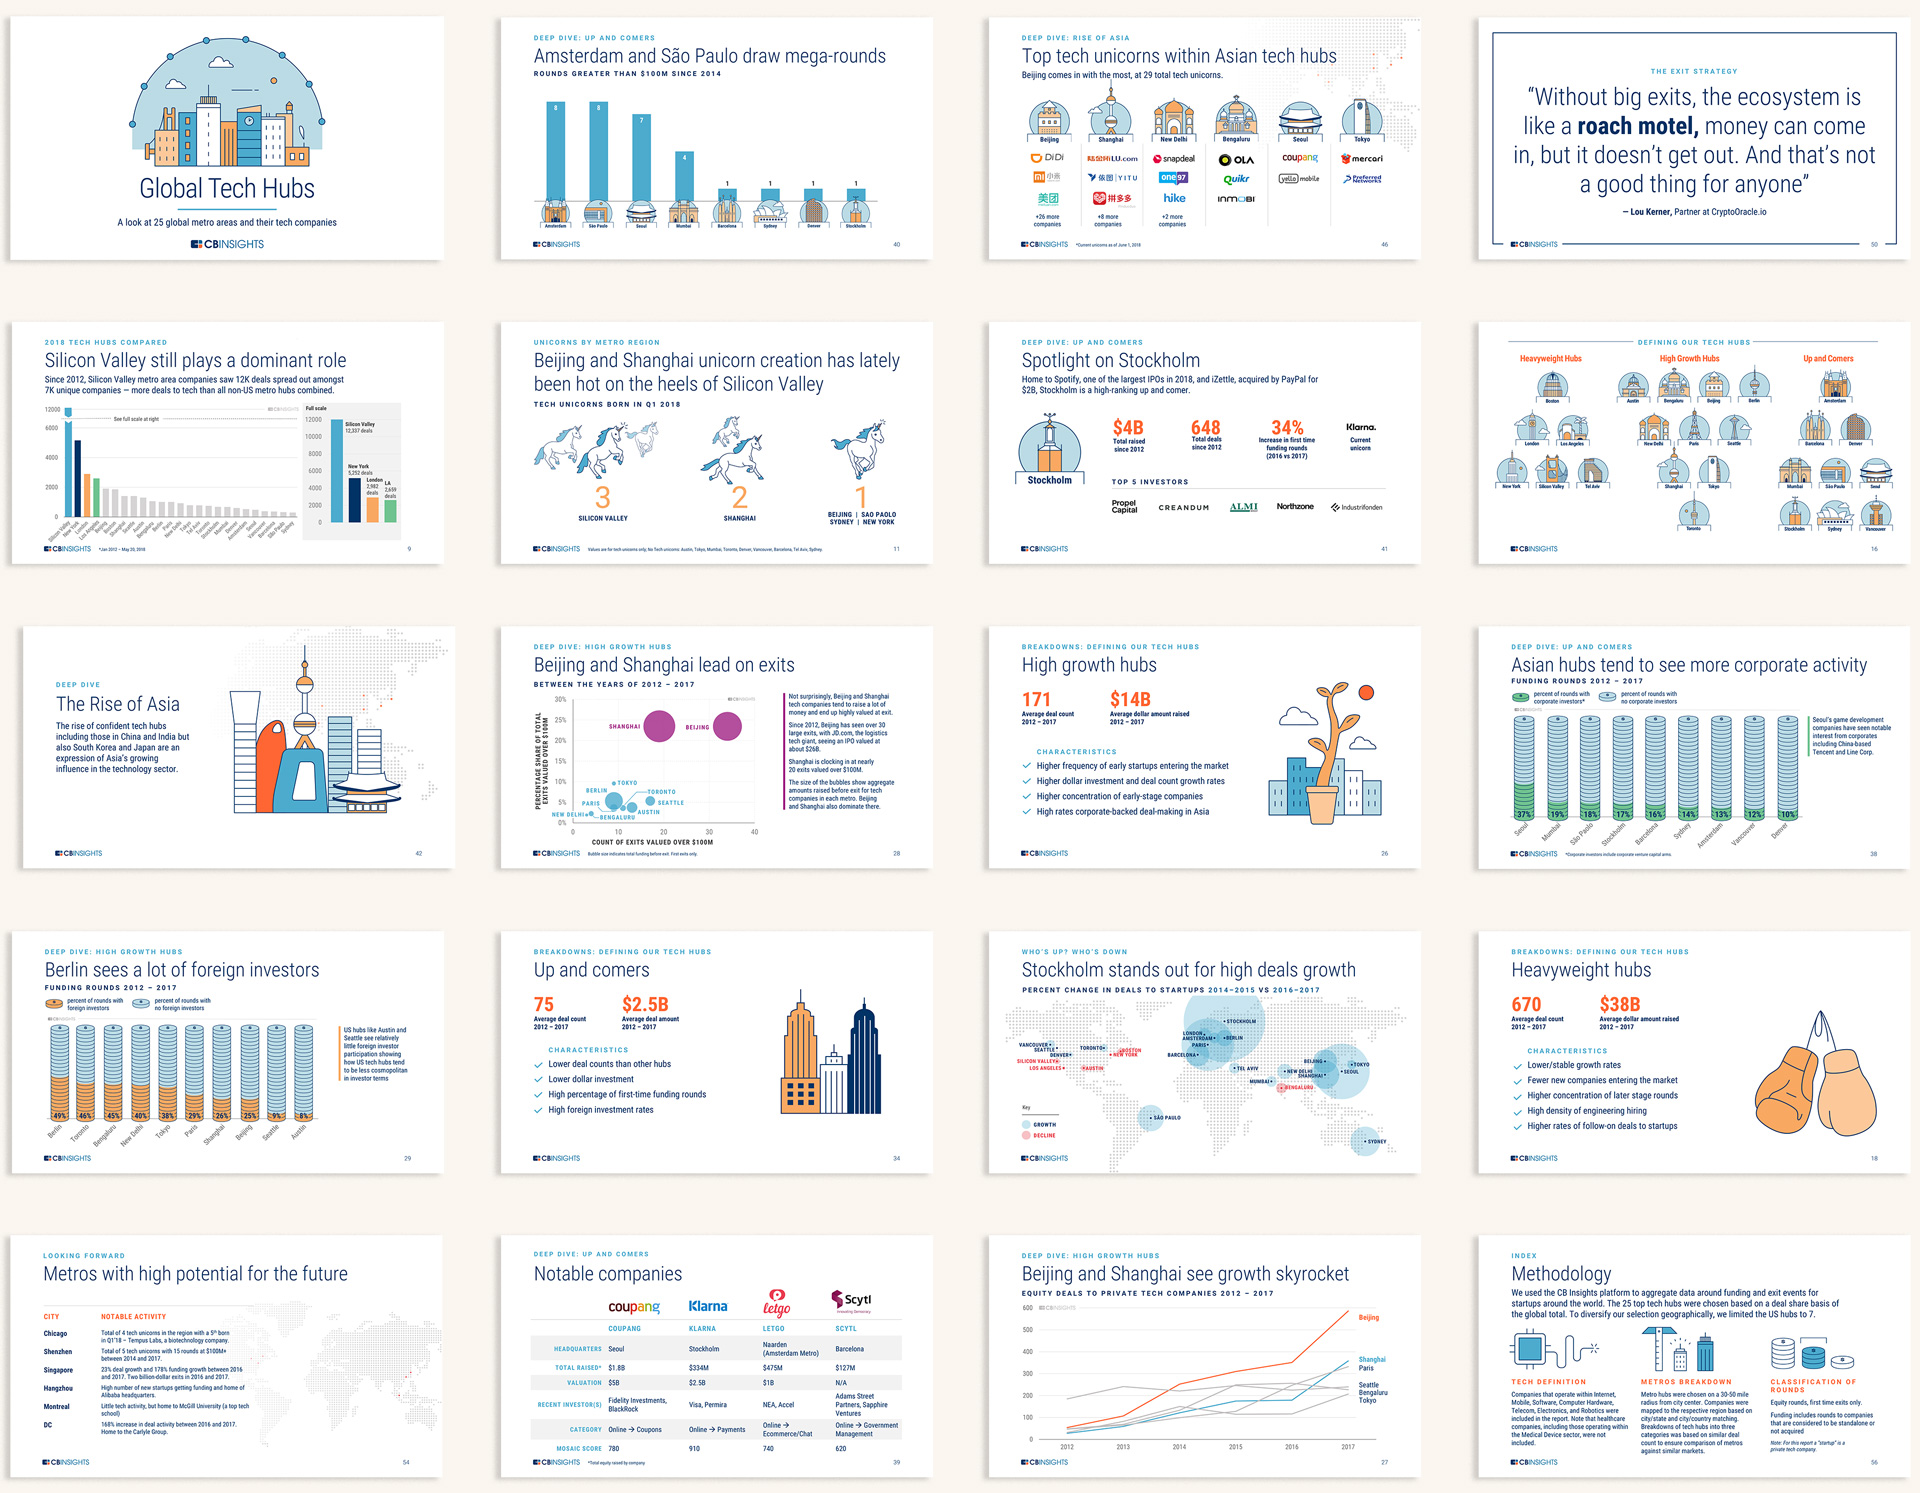
deep-dive editorial on global tech investment: